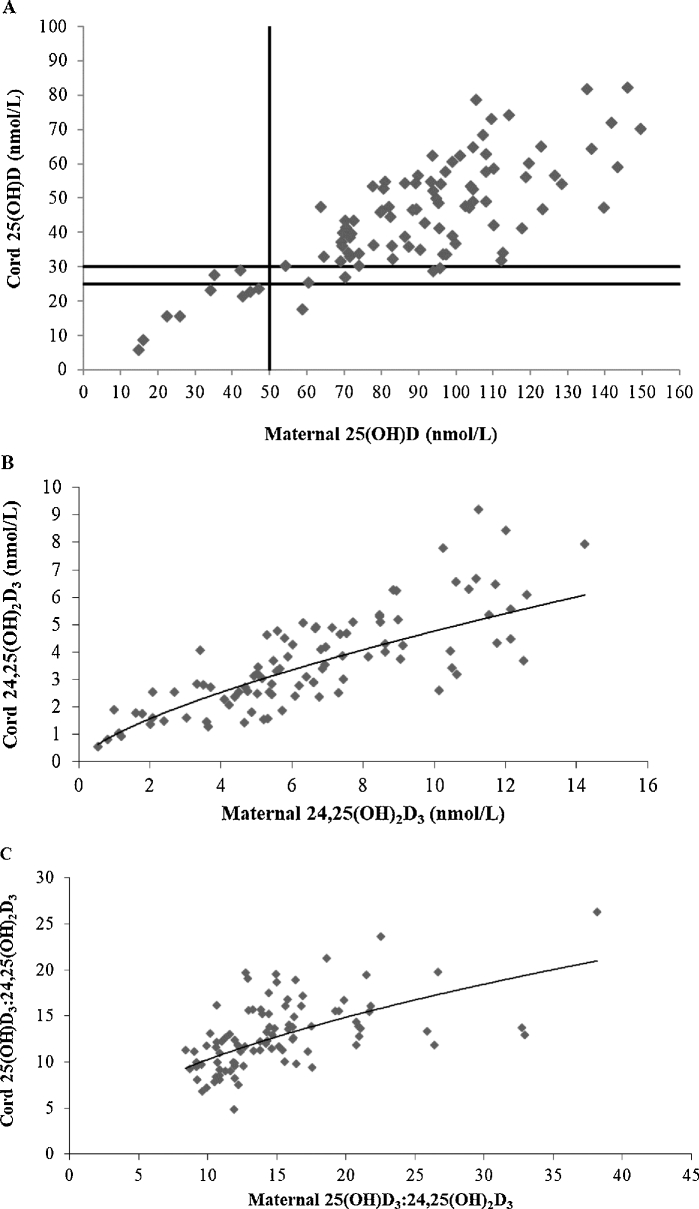
FIGURE 4.
Association of maternal 25(OH)D at 36 wk of gestation and umbilical cord 25(OH)D concentrations (linear trendline: y = 0.4391x + 5.6922; R² = 0.62; n = 96; r = 0.79, P < 0.001) (A). The vertical line represents maternal 25(OH)D at 50 nmol/L, and the horizontal lines represent cord 25(OH)D at 25 and 30 nmol/L. When maternal 25(OH)D concentration was ≥50 nmol/L, cord concentrations were ≥25 nmol/L in all but 1 and ≥30 nmol/L in 95% of newborns. Association of maternal 24,25(OH)2D3 at 36 wk of gestation and umbilical cord 24,25(OH)2D3 (power fit trendline: y = 0.9715x0.6905; R² = 0.68; n = 95; r = 0.80, P < 0.001) (B). Association of the ratio of maternal 25(OH)D3 to 24,25(OH)2D3 at 36 wk of gestation and the ratio of umbilical cord 25(OH)D3 to 24,25(OH)2D3 (power fit trendline: y = 2.9938x0.5346; R² = 0.33; n = 95; r = 0.55, P < 0.001) (C). 25(OH)D, 25-hydroxyvitamin D; 25(OH)D3, 25-hydroxyvitamin D3; 24,25(OH)2D3, 24,25-dihydroxyvitamin D3.

