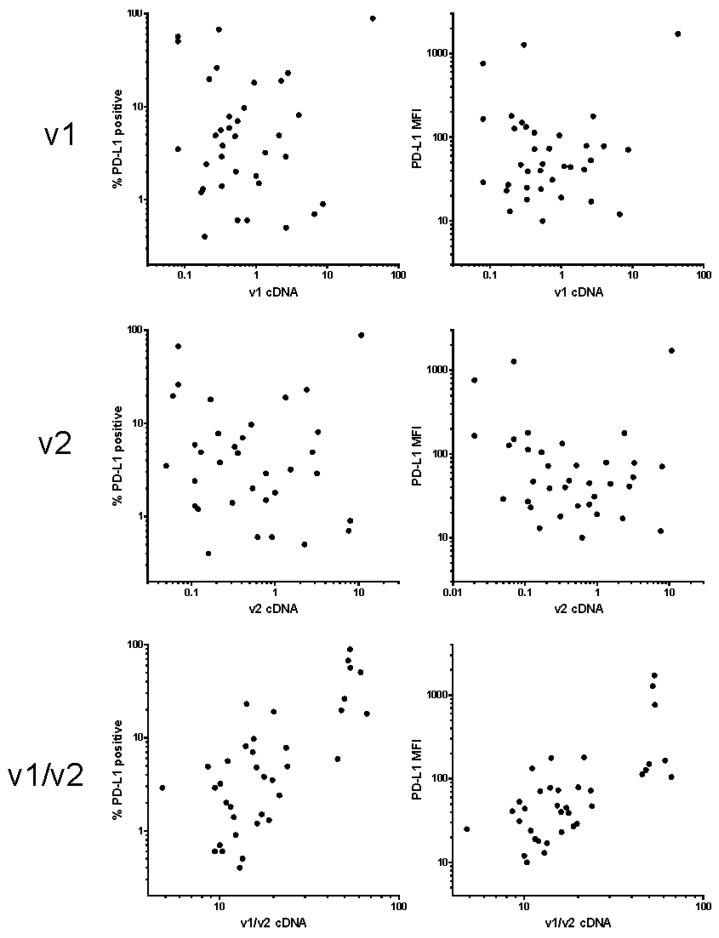
Figure 2.
Correlation of PD-L1 cell surface amount with the transcript levels. The amount of PD-L1 on acute myeloid leukemia (AML) blast surface was determined using flow cytometry and expressed as the percentage of positive cells (left column) or as the mean fluorescence intensity (MFI) of the blast population (right column). The relative levels of v1 and v2 transcripts were measured by PCR and normalized to GAPDH.

