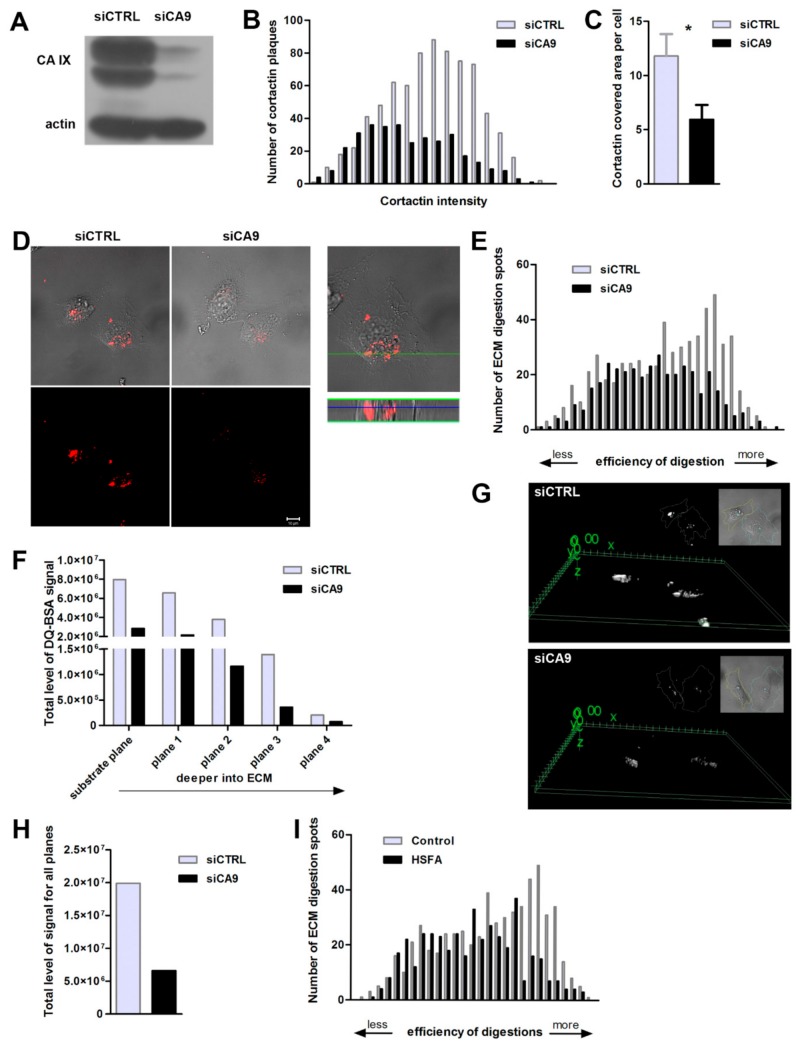
Figure 3.
CAIX expression promotes invadopodia formation and increases the efficiency of extracellular matrix digestion. (A) Representative Western blot proving a high efficiency of transient CA9 silencing in hypoxia-cultured HT1080 cancer cells. (B) Hypoxic CA9-attenuated (siCA9) and control CAIX expressing (siCTRL) HT1080 cells were grown for 5 h on FITC-collagen which allowed us to define the plane of the substrate. Samples were fixed and fluorescently stained for cortactin (N = 23 cells, in two independent experiments). CAIX expressing cells (siCTRL) show a higher number of cortactin-containing invadopodia characterized by stronger fluorescent intensity in comparison to CA9-suppressed cells (siCA9). These results indicate a stimulating role of CAIX in the cortactin accumulation during the invadopodia precursor assembly. (C) Analysis of the overall area covered by cortactin-containing invadopodia in individual cells. The graph shows mean ± stdev of cortactin-stained area fractions, calculated as a percentage of the total cell area. Cell areas were determined according to corresponding transmitted light (DIC) images. The area covered by cortactin-stained invadopodial plaques was significantly reduced in CA9-silenced cells (t-test, * p ≤ 0.05). (D-I) Hypoxic HeLa cells were seeded on the Matrigel layer mixed with DQ-BSA providing a red signal after active invadopodia-mediated focalized digestion of ECM. (D) Representative images of control (siCTRL) and CA9-attenuated cells (siCA9) taken with (upper row) and without transmitted light (bottom row) indicating impaired Matrigel cleavage by CA9-suppressed cells. Right-hand panel shows zoomed-in area of ECM digestion in a control cell. A green line indicates the position of z-section across the matrix depth displayed below. (E) Histogram of numbers of matrix degradation spots sorted by the intensity of DQ-BSA signal, reflecting efficiency of invadopodial proteolytic activity, in CAIX expressing and CA9 silenced cells (N = 21 for each sample in two independent experiments). (F) Graph shows the total level of positive fluorescent signal originating from digested matrix for all 21 CAIX expressing and CA9-depleted cells. Data were processed separately for each plane, from the substrate plane (0) to planes located deeper inside the Matrigel (1 to 4). The signal evaluation includes the overall area of digestion as well as the intensity of digested spots. (G) 3D model of digested matrix signal (DQ-BSA) created for representative images of CAIX expressing (upper panel) and CA9-attenuated cells (lower). The modeling was done in 3D Viewer plugin in ImageJ from substacks of ECM planes, where digestion takes place. Cell outlines were drawn according to corresponding DIC images of cells. (H) Total level of digested matrix signal summed up for all planes for all processed cells confirming a higher efficiency of Matrigel digestion of CAIX positive cells. (I) Histogram of numbers of matrix digestion spots sorted by the intensity of DQ-BSA signal comparing cells (N = 21) treated with HSFA, which inhibits catalytic activity of CAIX, and cells with fully active CAIX (DMSO, N = 21).

