Figure 5.

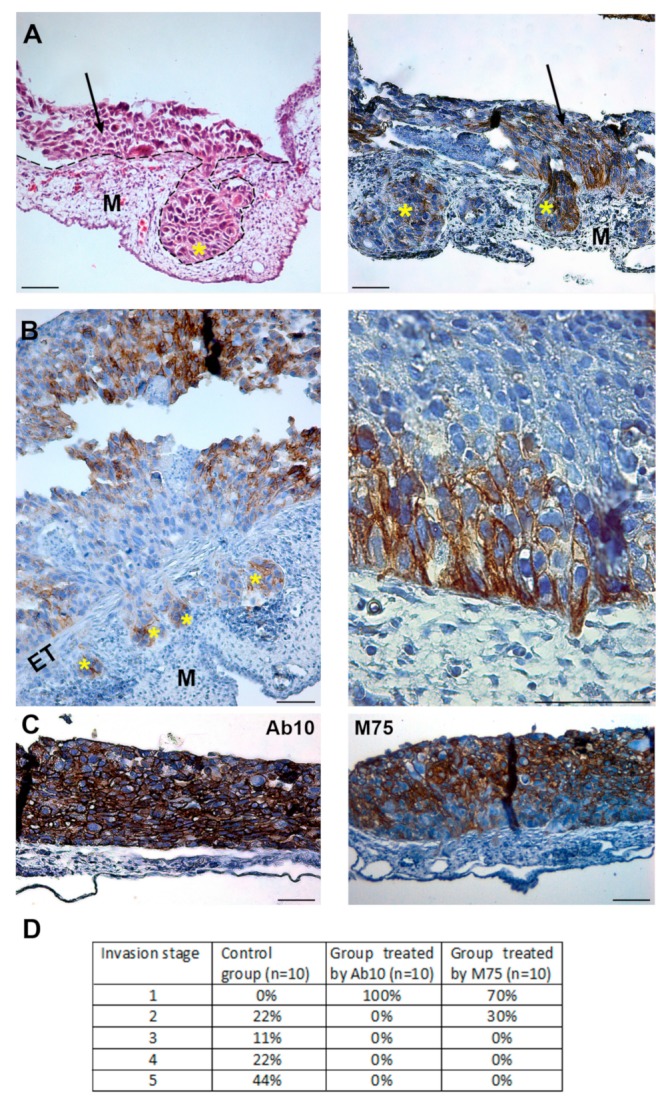
The effect of CAIX on invasion of hypoxic tumor cells in the quail chorioallantoic membrane (CAM) model. Hypoxia pre-incubated TE-1 cells (48 h, 1% O2) were grafted onto the day 7 quail embryo and cultivated ex ovo for 3 days. Hematoxylin and Eosin staining, and imunohistochemical staining of CAIX. (A) Hypoxic tumor cells (outlined by dashed line) invaded into CAM and formed metastatic foci (marked by asterisks) in the mesoderm (M) which are positive for CAIX staining. Left image: hematoxylin and eosin staining, right image: immunostaining of CAIX. Tumor cells adhering on the ectoderm layer of CAM are indicated by arrows. (B) Immunostaining of CAIX of control, untreated cells invading into the mesoderm (M). Left image: clusters of migrating cells display CAIX localization at the invasive front (denoted by asterisks). Right image: distribution of CAIX into invadopodium penetrating the ectoderm layer. (C) Effect of anti-CAIX antibodies on invasion ability of TE-1 cells. Hypoxia pre-incubated TE-1 cells were treated by anti-CAIX antibodies before the seeding on CAM. Ab10 antibody targeting the carbonic anhydrase domain completely inhibited the metastatic properties of cancer cells. Anti-PG antibody (M75) strongly suppressed the invasive capability of TE1 cells. Scale bars 50 µm. Ectoderm layer of CAM (ET), mesoderm (M). (D) The effect of CAIX targeting antibodies on hypoxic tumor cell invasion into CAM. The invasion process was divided into five stages. Increasing numbers denote gradually advancing invasion. The stages 1 to 5 are defined as follows: (1) no cells invading into CAM; (2) only a few invading cells which penetrate the ectoderm layer; (3) cells started invading the mesoderm; small clusters are being formed; (4) cells invaded into the mesoderm, metastatic foci had already been formed, (5) considerable metastasis throughout the whole CAM structure. Five CAMs with grafted cells were assessed for each sample during two independent experiments. The values in the table give the portions (in %) of all evaluated CAMs (from both experiments) allocated to separate stages.
