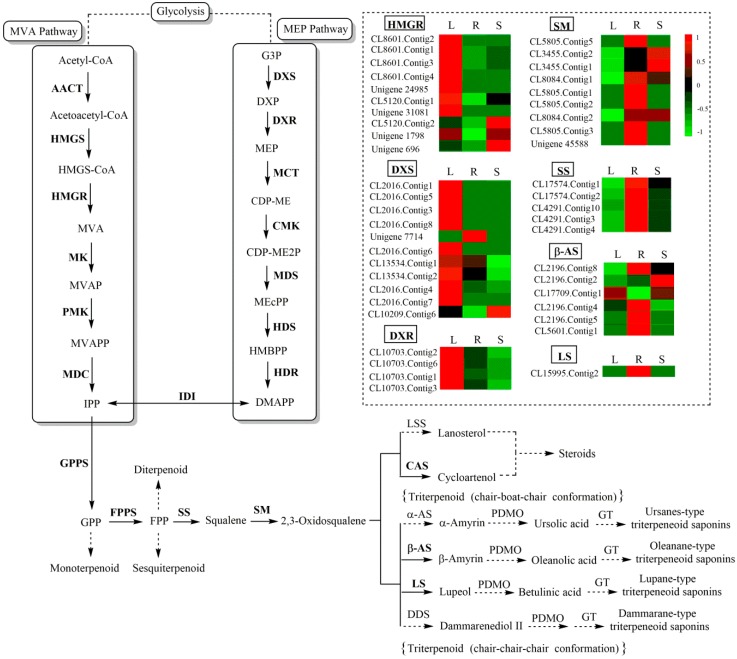
Figure 3.
Pathway for triterpenoid saponin biosynthesis in C. chinense. The expression levels of unigenes encoding key enzymes from each process are shown using a heatmap. The columns L, R, and S correspond to leaf, root, and stem samples, respectively; red and green represent high and low expression levels, respectively.

