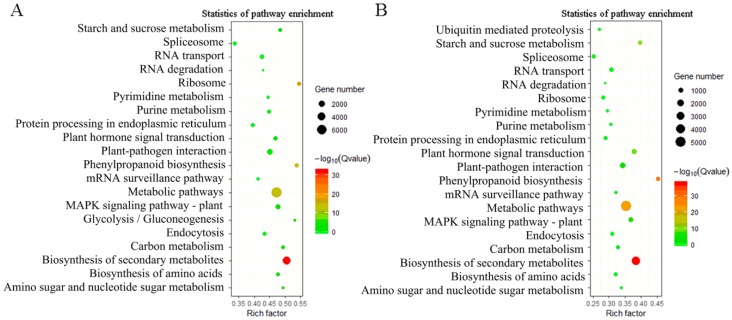
Figure 6.
Enrichment of differentially expressed genes (DEGs) in KEGG pathway. (A) Significantly enriched pathways for DEGs in leaf versus root tissues. (B) Significantly enriched pathways for DEGs in stem versus root tissues. The x-axis represents the rich factor (the value of the enrichment factor, which is the quotient of the foreground value (number of DEGs) and background value (total gene amount)), and the y-axis represents KEGG pathways.

