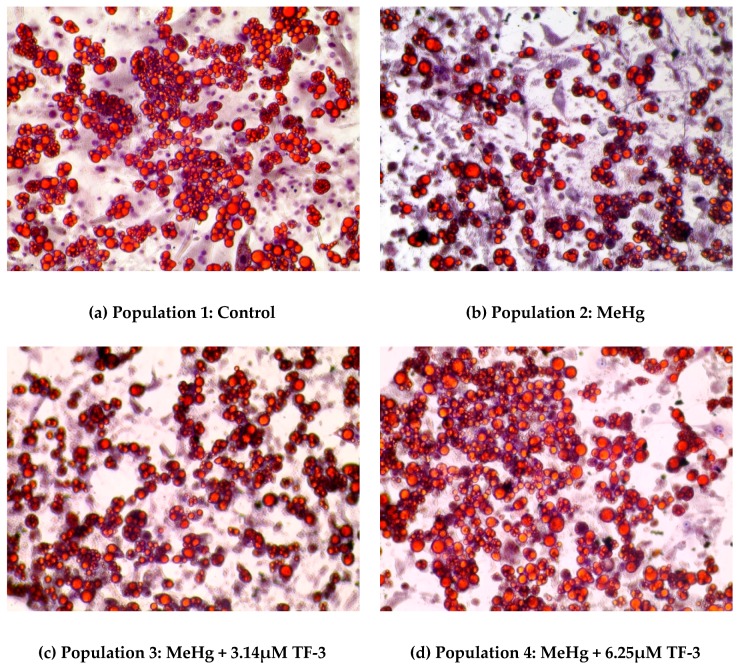
Figure 1.
Morphology changes caused due to different treatments to mature adipocytes on Day 28 using lipid staining. (a) shows the stained lipids in the control group (Population 1); (b) shows the stained lipids under MeHg exposure (Population 2); (c) shows the stained lipids exposed to MeHg and 3.14µM TF-3 (Population 3); (d) shows the stained lipids exposed to MeHg and 6.25 µM TF-3 (Population 4).

