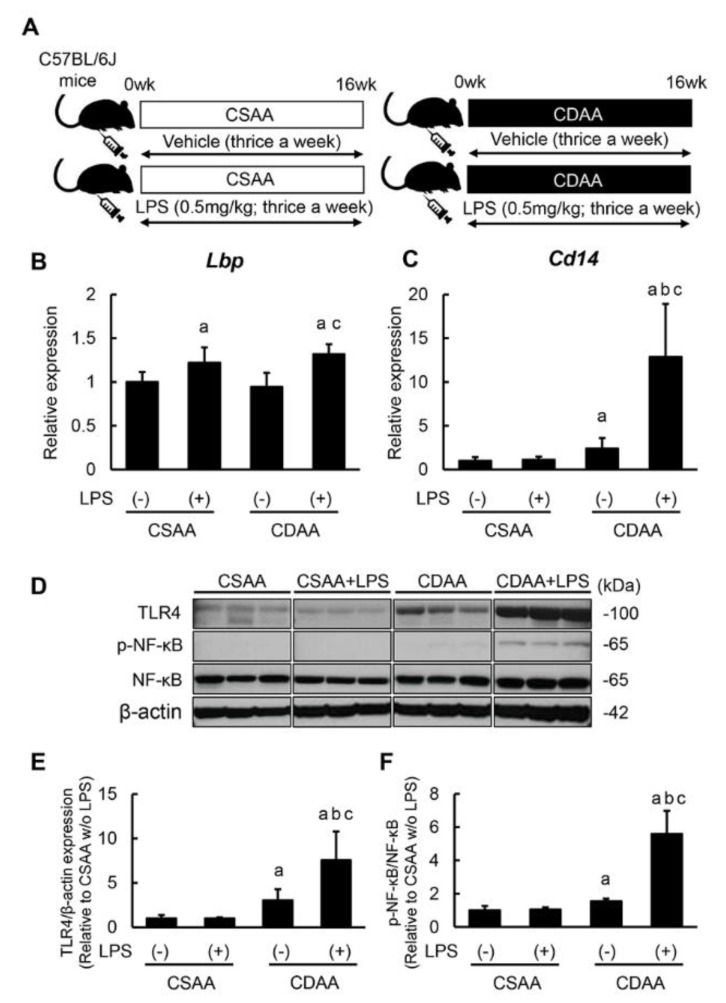
Figure 1.
Activation of hepatic TLR 4/NF-κB signaling pathway by CDAA diet feeding and LPS administration. (A) Schematic of LPS administration to CDAA diet-induced steatohepatitis model. (B,C) Relative mRNA expression levels of Lbp (B) and Cd14 (C) in the liver of experimental mice. (D) Western blots for TLR4 expression and NF-κB phosphorylation in the liver of experimental mice. (E) Quantification of protein expression of TLR4. (F) Quantitative phosphorylation rate of phosphorylated NF-κB/NF-κB. The mRNA expression levels were measured by quantitative RT–PCR (qRT–PCR), and Gapdh was used as internal control for qRT–PCR (B,C). The protein was determined by western blotting, and β-Actin was used as the loading control (D). Quantitative values are indicated as ratios to the values of CSAA-LPS (−) group (B,C,E,F). Data are mean ± SD (n = 6). a: p < 0.05 compared with CSAA-LPS (−), b: p < 0.05 compared with CSAA-LPS (+), c: p < 0.05 compared with CDAA-LPS (−).

