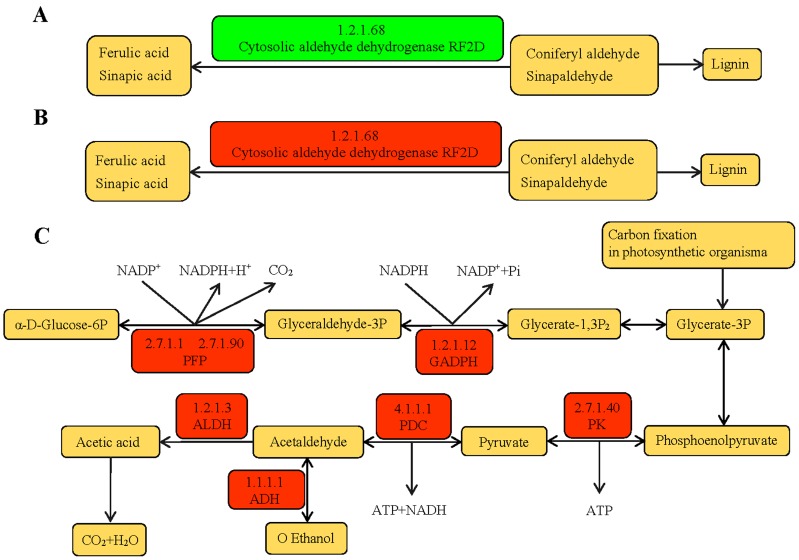
Figure 7.
(A) Glycolysis/gluconeogenesis pathway. (B) Phenylpropanoid biosynthesis pathway in CD vs. CCK. (C) Phenylpropanoid biosynthesis pathway in TD vs. TCK. Red boxes represent the up-regulated proteins under simulated drought stress. Green boxes represent the down-regulated proteins under simulated drought stress. Yellow boxes represent metabolites.

