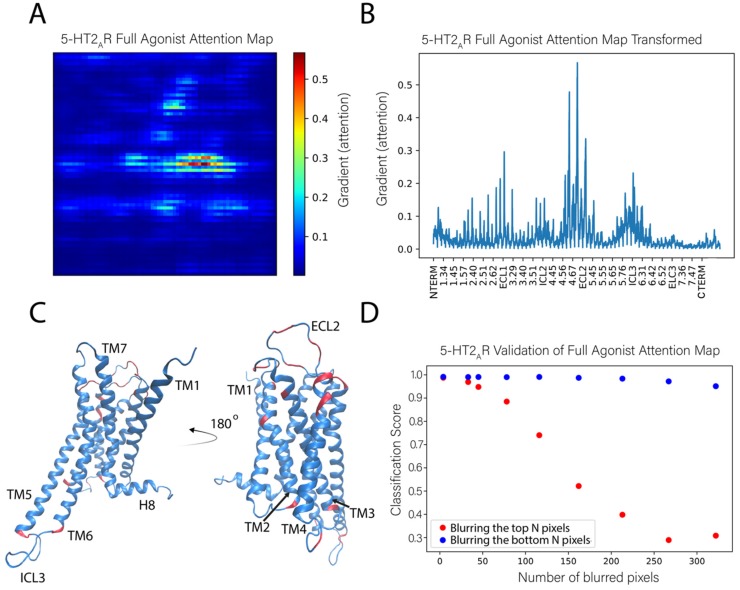
Figure 6.
Identification of the molecular determinants of the classification of the full agonist bound to the 5-HT2AR. (A) The full agonist attention map shown was obtained as the average of 1000 attention maps calculated from 1000 instances of the full agonist bound to the 5-HT2AR. (B) Representation of the (average) attention map in panel A in which all the pixels (i.e., atoms) are listed on the X axis. The tick marks on the X axis identify residues labeled with the generic Ballesteros–Weinstein numbering [20]. The gradient values calculated for the classifier for individual atoms is on the Y axis, it indicates the order of importance (salience) of each atom for the classification. (C) The positions of the most important residues for the classification are indicated (in orange) on the ribbon representation (in blue) of the 5-HT2AR model structure. The highlighted residues contain atoms whose gradient (attention) is >0.15. (D) Validation of the attention map by evaluation of the effect of blurring increasing numbers of pixels (atoms) in the representation of the protein complex. Orange dots indicate the results of blurring increasing numbers of pixels identified to have the lowest gradient (least important). Blue dots indicate the results of blurring pixels with the highest gradient (most important). The number of atoms blurred is shown on the X axis while the Y axis shows the corresponding classification score of the full agonist for the blurred images.

