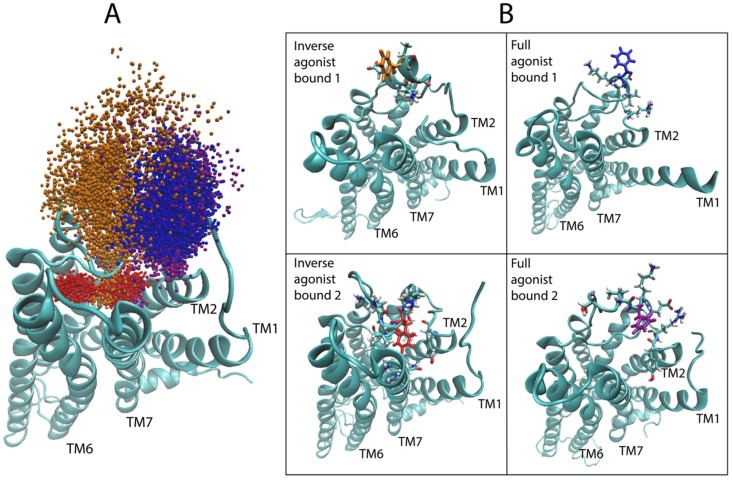
Figure 8.
Conformational dynamics of residue F222 in ECL2 identified by the positions of the epsilon carbon atom Cε of F222 in the simulation trajectories. (A) Sampling of the coordinates of Cε of F222 (atom 2532), the top hit of the sensitivity analysis for serotonin (5-HT), in the aligned trajectories of the 5-HT2AR bound to the inverse agonist ketanserin (KET) (red and orange) and the full agonist 5-HT (blue and purple). (B) Representative frames from each of the four trajectories shown in the previous panel. F222 is colored solidly according to the bound ligand, ketanserin (red and orange) and serotonin (blue and purple).

