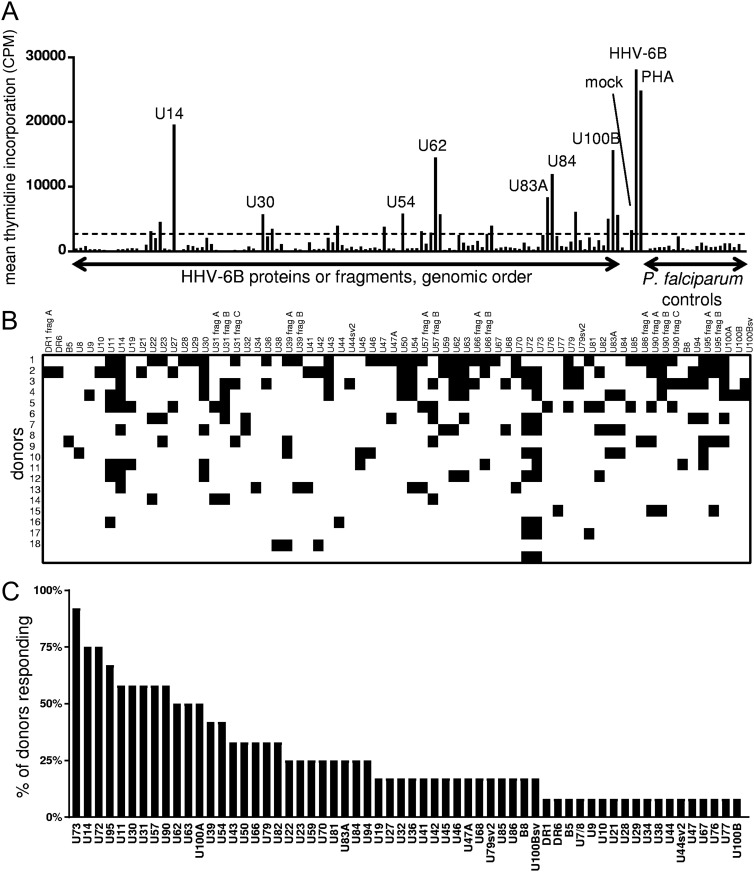
FIG 2.
Genome-wide HHV-6B CD4 T-cell antigen screens. (A) Representative data from the same donor as in Fig. 1A, C, and D. Shown are responses of polyclonal HHV-6B-reactive CD4 T cells to individual HHV-6B polypeptides, or controls, including mock or HHV-6B-infected lysate, PHA, or irrelevant Plasmodium falciparum proteins. CPM, counts per minute. The dotted horizontal line is the statistical cutoff for positive responses. (B) Summary of CD4 T-cell responses to the HHV-6B proteome. Positive responses are denoted by black squares. frag, fragment. (C) Population prevalence hierarchy of CD4 T-cell responses to HHV-6B proteins. Responses to >1 fragment for proteins studied in segments are collapsed to one positive response. sv, splice variant, as detailed in Table S1 in the supplemental material.

