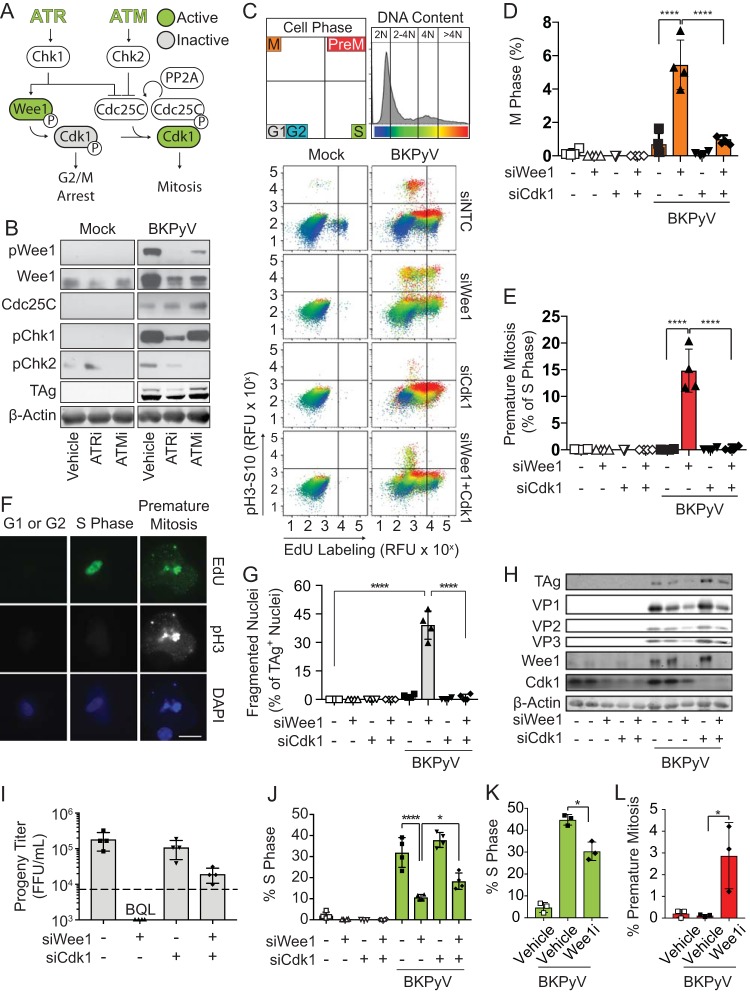
FIG 6.
Premature mitosis was the source of DNA damage due to ATR inhibition during BKPyV infection. To determine if ATR activates the Wee1 pathway to block premature mitosis during BKPyV infection (multiplicity of infection of 0.5), Wee1 and/or Cdk1 was silenced with siRNAs to induce and/or block premature mitosis, respectively. At 72 hpi cells were harvested to assess the amount of premature mitosis and DNA damage during BKPyV infection. *, P < 0.05; **, P < 0.01; ***, P < 0.001; ****, P < 0.0001. (A) A diagram showing how ATM and ATR regulate the G2/M checkpoint. ATR and ATM activation stimulates Chk1 and Chk2, respectively. Activation of the Wee1 kinase inhibits Cdk1 through phosphorylation leading to G2/M arrest. Simultaneously, DDR activation inhibits Cdc25C, the phosphatase that reactivates Cdk1 to promote mitosis. Cdc25C turnover requires protein PP2A. (B) Western blot of G2/M checkpoint control proteins in BKPyV-infected (multiplicity of infection of 1.0) or mock-infected cells treated with ATRi, ATMi, or a vehicle control (DMSO) from 48 to 72 hpi. Data shown are representative of n = 3 biological replicates. (C) Levels of mitosis and premature mitosis measured by FACS as described in the legend of Fig. 1G. Data representative of n = 4 replicates are shown. (D and E) Quantification of cells from the experiment shown in panel C that are mitotic or undergoing premature mitosis. Values are the means ± standard deviations of n = 4 biological replicates. Symbols are as follows: white, mock-infected cells; black, BKPyV-infected cells; square, siNTC treatment; upward triangle, siWee1 treatment; downward triangle, siCdk1 treatment; diamond double-knockdown treatment. Significant differences were determined by two-way ANOVA with Tukey’s post hoc test. (F) To determine if cells undergoing premature mitosis acquire DNA damage, siWee1 samples stained for FACS (C) were analyzed by IFA for evidence of BKPyV-induced DNA damage. Results shown are representative of >20 cells from G1, S, or premature mitosis from the experiment shown in panel C for n = 3 biological replicates. EdU incorporation (green), pH3S10 (white), and chromatin (blue) are represented. Scale bar, 20 μm. (G) DNA damage was assessed by nuclear morphology using immunofluorescent microscopy of TAg and DAPI staining. The percentage of DNA-damaged nuclei (fragmented) was quantified from at least 100 nuclei per condition per replicate. Data are means ± standard deviations for n = 4 biological replicates. Significant differences were determined by two-way ANOVA with Tukey’s post hoc test. (H) Western analysis of markers of viral infection and knockdown efficiency for Wee1 and Cdk1. Values representative of n = 4 biological replicates are shown. (I) The impact of Wee1 silencing on BKPyV titers was determined by focus-forming assays. The means ± standard deviations for n = 4 biological replicates are shown. The dotted line represents the quantifiable limit of detection for the assay. BQL, below the quantifiable limit. (J) The percentages of cells in S phase from the experiment shown in panel C were quantified and are presented as means ± standard deviations for n = 4 biological replicates. Significant differences were determined by two-way ANOVA with Tukey’s post hoc test. (K and L) RPTE cells were mock or BKPyV infected (multiplicity of infection of 0.5) and then at 24 hpi treated with Wee1i (300 nM MK1775). Cell cycle analysis to identify S phase (EdU) and premature mitosis based on pH3S10 expression was performed by FACS at 72 hpi. The mean percentage of cells in each phase ± standard deviation is shown for n = 3 biological replicates. Symbols are as follows: white, mock infection; black, BKPyV black infection; square, vehicle control; diamond, Wee1i.

