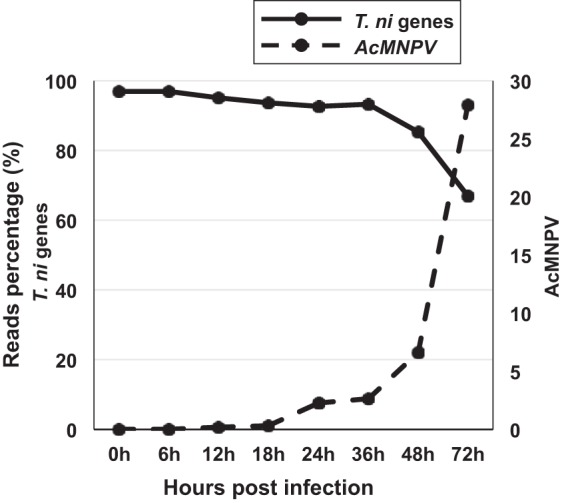
FIG 1.

T. ni and AcMNPV mRNA reads as a percentage of total mRNA reads at each time point from 0 to 72 h p.i. The percentages of AcMNPV mRNA reads in the infected midgut are indicated by the dashed line (right y axis), and the percentage of T. ni mRNA reads in the infected midgut are shown as a solid line (left y axis). T. ni reads were identified by mapping cleaned reads to the T. ni genome, and AcMNPV reads were identified by mapping cleaned reads to the AcMNPV genome.
