
FIG 5.
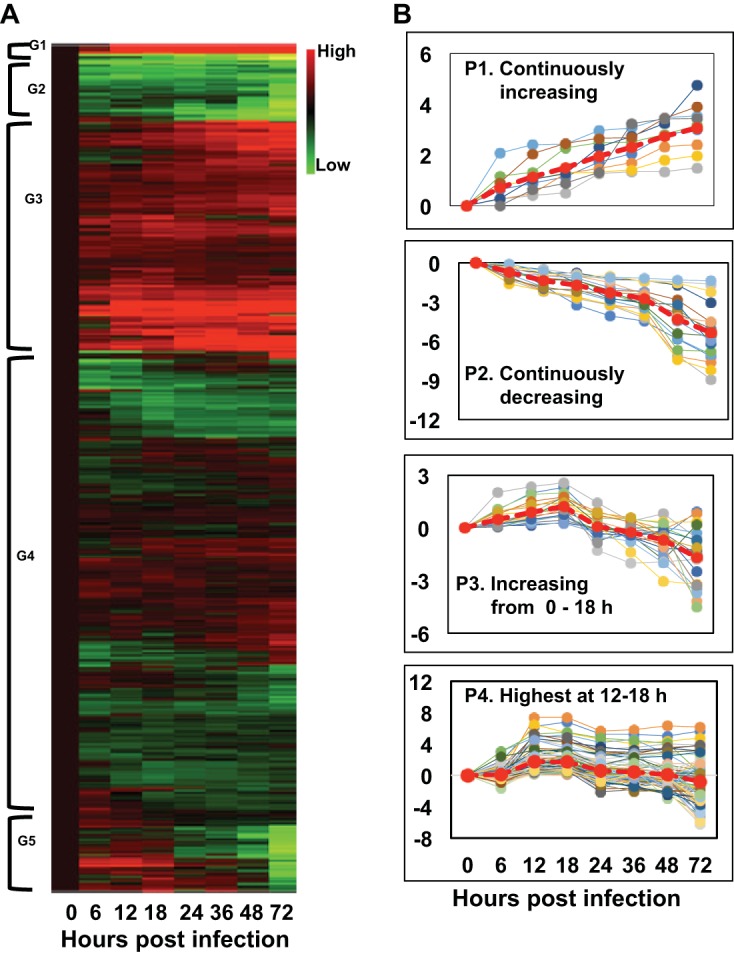
Patterns of differentially expressed (DE) T. ni genes following AcMNPV infection of the midgut. (A) A cluster analysis of DE T. ni midgut transcripts is shown as a heat map that was generated by performing hierarchical cluster analysis on normalized read counts (log2 transformed) of DE transcripts from infected midgut samples from 0 to 72 h p.i. Normalized read counts from each biological replicate were averaged, and then the averaged normalized read counts at 0 h p.i. were subtracted from each time point’s normalized read counts. Euclidean distance metrics were then applied to the normalized read counts using R software. In the illustrated heat map, the expression levels of each gene (rows) at each time point (columns) are depicted with a color scale in which green represents low-level expression and red represents high-level expression. The cluster analysis grouped DE transcripts into five clusters based on their expression levels. The groups were arbitrarily assigned the names G1, G2, G3, G4, and G5. (B) From the list of T. ni transcripts grouped by the cluster analysis, transcripts with specific patterns (as indicated) were identified using an R script and named P1 to P4.