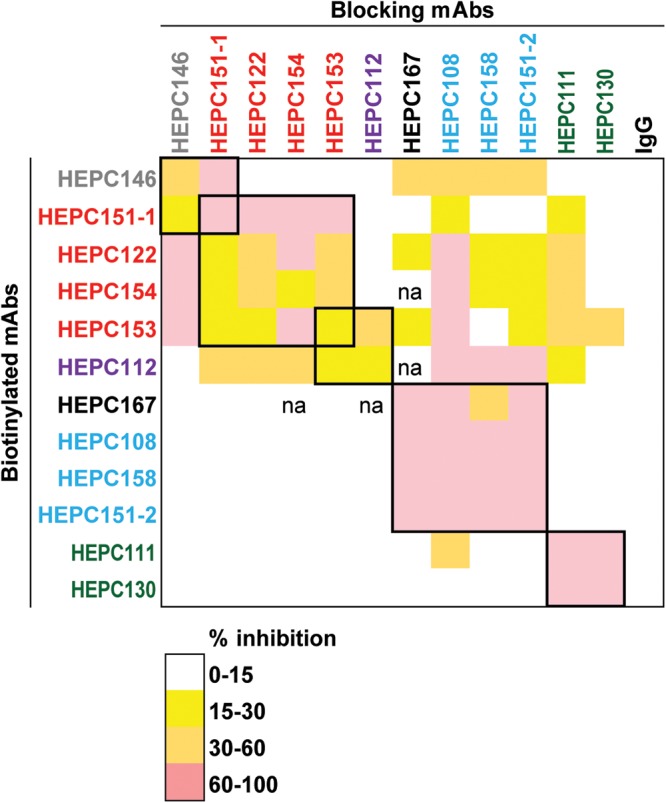
FIG 5.

C18 MAbs formed five groups based on E1E2 competition binding. Percent inhibition of binding of 2 μg/ml or 0.4 μg/ml of biotinylated MAbs to E1E2 proteins in an ELISA in the presence of blocking MAbs at a concentration of 20 μg/ml. Squares at the intersection between blocking and biotinylated MAbs are color coded by the degree of inhibition. Groups of MAbs that were mutually inhibitory (i.e., binding of each MAb inhibited each other MAb in the group and was inhibited by each other MAb in the group) are marked with thick black boxes. Values are averages of three independent experiments, each performed in duplicate. MAb names are color coded according to hierarchical clustering in Fig. 2 Data not available is marked “na.”
