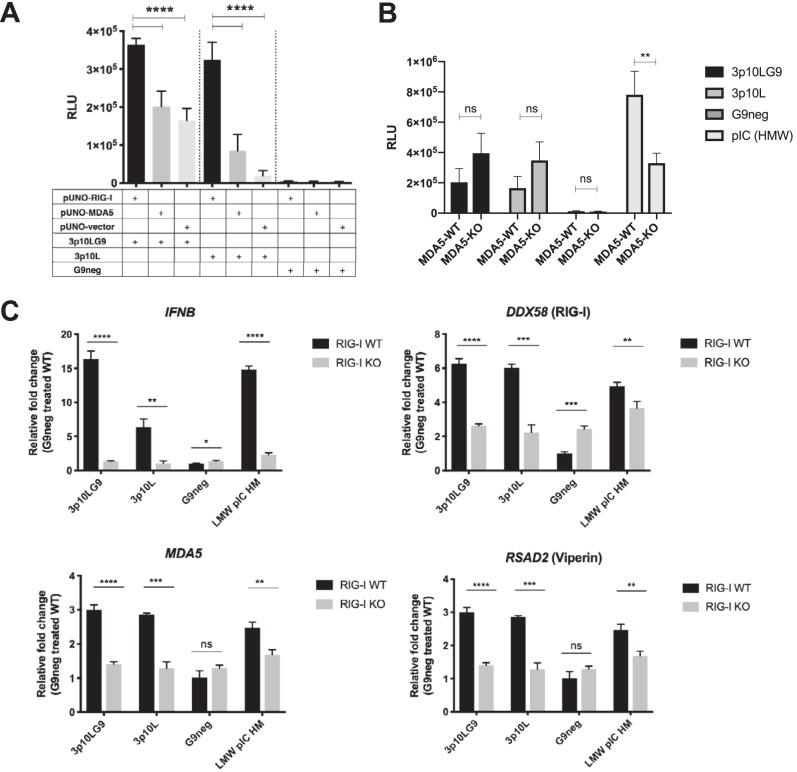
FIG 2.
The interferon signal induced by 3p10LG9 is RIG-I dependent. (A) HEK-293T cells were transfected with 50 ng of pUNO-hRIG-I or pUNO-hMDA5. These cells were then transfected with a 10 nM concentration of either 3p10LG9, 3p10L, or G9neg. Supernatant from these transfected HEK-293T cells was incubated on HEK-293T cells containing a luciferase reporter driven by interferon-stimulated response element (ISRE-luc). Luminescence was measured at 6 h after incubation with the supernatant. Bars shown means ± standard deviations (SD). Statistical significance was determined using a one-way ANOVA test with multiple comparison (****, P ≤ 0.0001). (B) A549 cells (MDA5-WT) and A549-Dual KO-MDA5 cells (MDA5-KO) were transfected with 3p10LG9 (2 nM), 3p10L (2 nM), or HMW poly(I·C) (1 μg/ml), and luciferase activity was measured 24 h later by adding the supernatant to HEK293T ISRE-luc reporter cells. Data were generated by triplicate transfections from two independent experiments. Bars show means ± SEM. Statistical significance was determined with ordinary two-way ANOVA with Sidak’s multiple-comparison test (**, P ≤ 0.005; ns, not significant). (C) 3p10LG9, 3p10L, G9neg, or LMW poly(I·C) was transfected into either RIG-I knockout U937-DC cells (KO) or the parental U937-DC cells (WT). Gene expression analysis on mRNA extracted from transfected U937-DC cells for IFNB, DDX58 (RIG-I), MDA5, and RSAD2 (Viperin) was performed. Data are represented as fold change compared to the mean for the G9neg-treated RIG-I WT sample. Bars show means ± SD for triplicate transfections, and data are representative of two independent experiments. Statistical significance was determined using a two-tailed Student t test (*, P ≤ 0.05; **, P ≤ 0.01; ***, P ≤ 0.001; ****, P ≤ 0.0001; ns, not significant).

