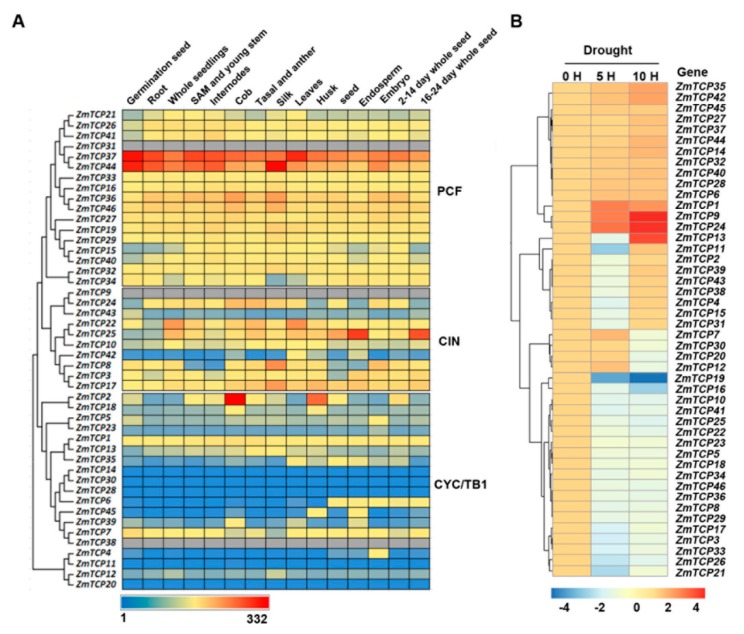
Figure 3.
Expression patterns of ZmTCP genes in tissues and in response to drought conditions. (A) A heat map depicting gene expression levels of 46 ZmTCPs in fifteen different tissues from various developmental stages. Normalized gene expression values are shown in different colors that represent the levels of expression indicated by the scale bar. The gray color represents unavailable data. (B) Microarray-based expression analysis of ZmTCP genes. A heat map was generated based on the fold-change values in the treated samples, when compared with the unstressed control. The color scale for fold-change values is shown at the bottom. The drought-treated leaf samples were collected at two time points, 5 and 10 h, which reflected relative leaf water content (RLWC) of 70% and 60%, respectively.

