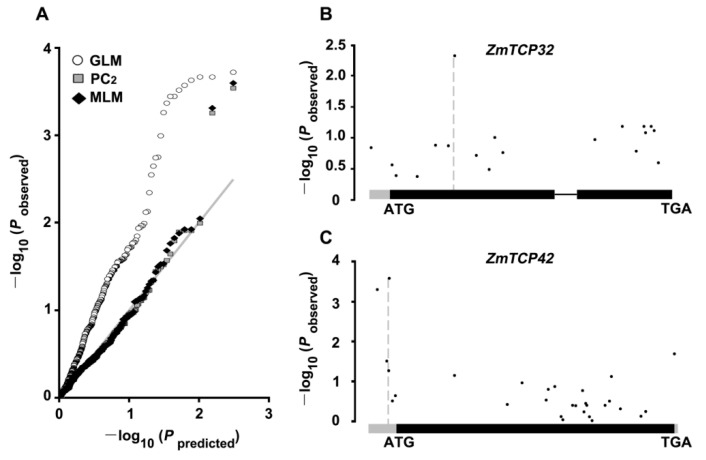
Figure 4.
Association analysis of genetic variations in ZmTCP32 and ZmTCP42 with maize drought tolerance. (A) Quantile–quantile plots of the estimated −log10(p) from the ZmTCP gene family-based association analysis, using three methods. The gray line is the expected line under the null distribution. The white square represents the observed p values using general linear model (GLM); the gray square represents the GLM model with the first two principal components (PC2); the black diamond represents the observed p values using the mixed linear model (MLM) model incorporating both PC2 and a Kinship matrix. (B,C) Schematic diagrams of ZmTCP32 (B) and ZmTCP42 (C), including the UTR (gray), intron (thin black line), and protein coding regions (thick black line), are presented in the x-axis. The p value is shown on a −log10 scale.

