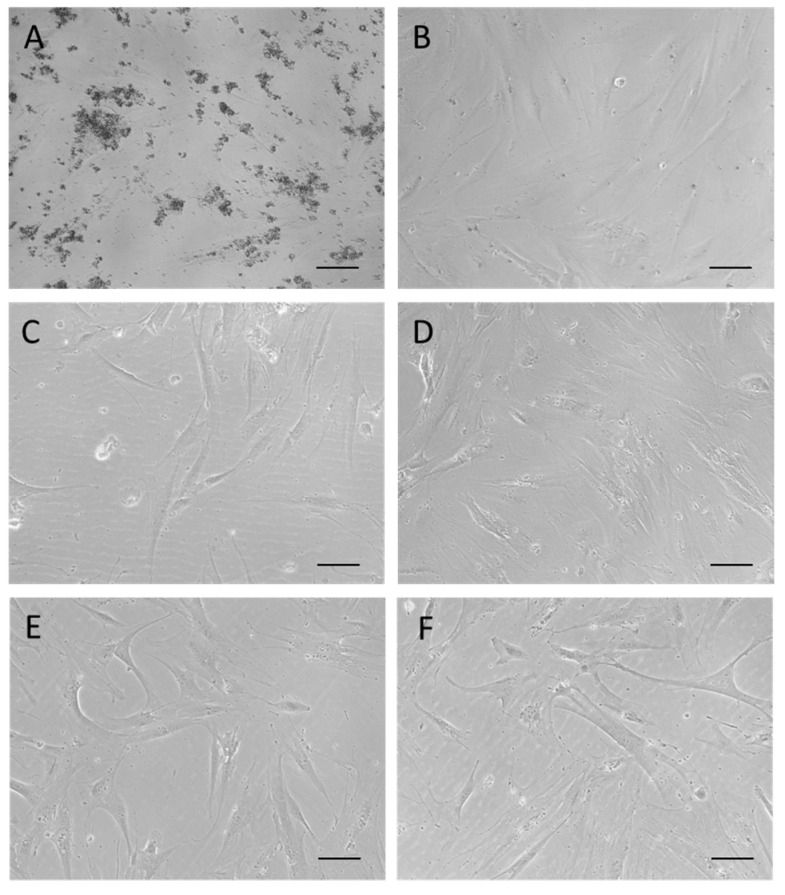
Figure 7.
Micrographs at the inverted optical microscope of hMSCs in culture after 24 h of treatment with: (A) CN at 10 µg/mL; (B) NL at 10 µg/mL; (C) CN-NL at 0.2 µg/mL; (D) CN-NL/GA at 0.5 µg/mL; (E) GA at 0.5 µg/mL; (F) control. Micrographs are representative of each compound administrated at the intermediate concentration in the tested ranges. Original magnification 100×, scale bar = 100 µm.

