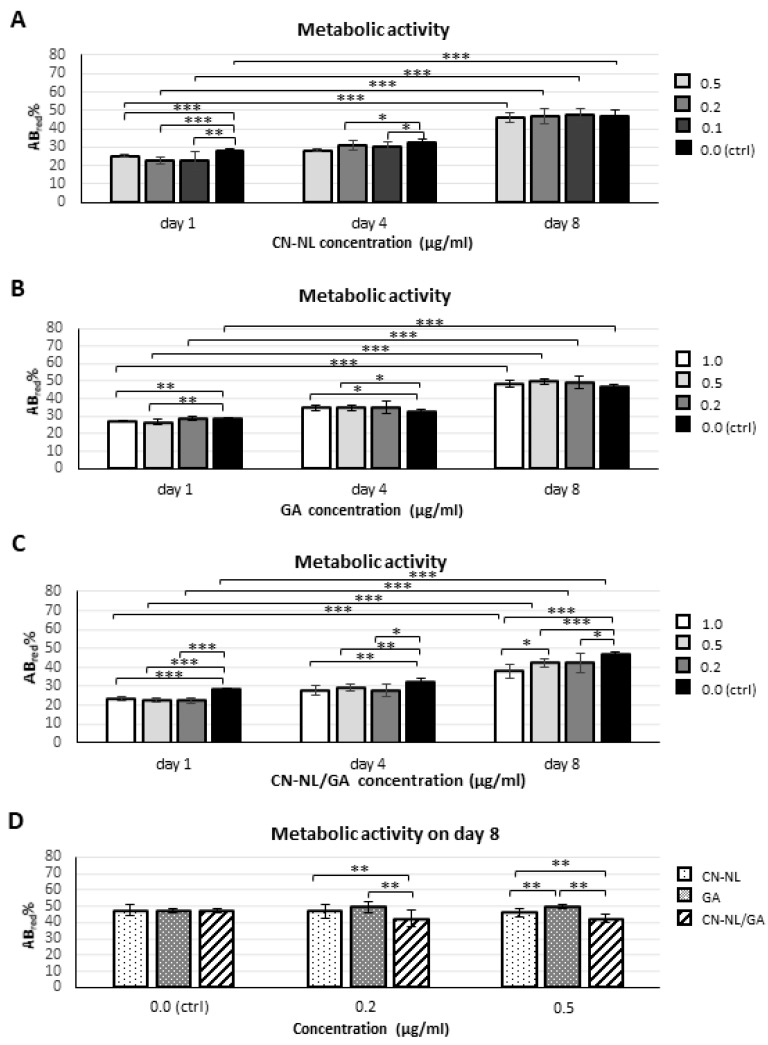
Figure 8.
Bar graphs showing metabolic activity, as obtained by alamarBlue® test, performed on undifferentiated hMSCS using CN-NL, GA and CN-LN/GA complexes: (A–C) at different time points (1, 4 and 8 days in culture) and selected concentrations for each compound; (D) on day 8, comparing the three compounds within homogeneous concentration groups (* p < 0.01, ** p < 0.001, *** p < 0.0001).

