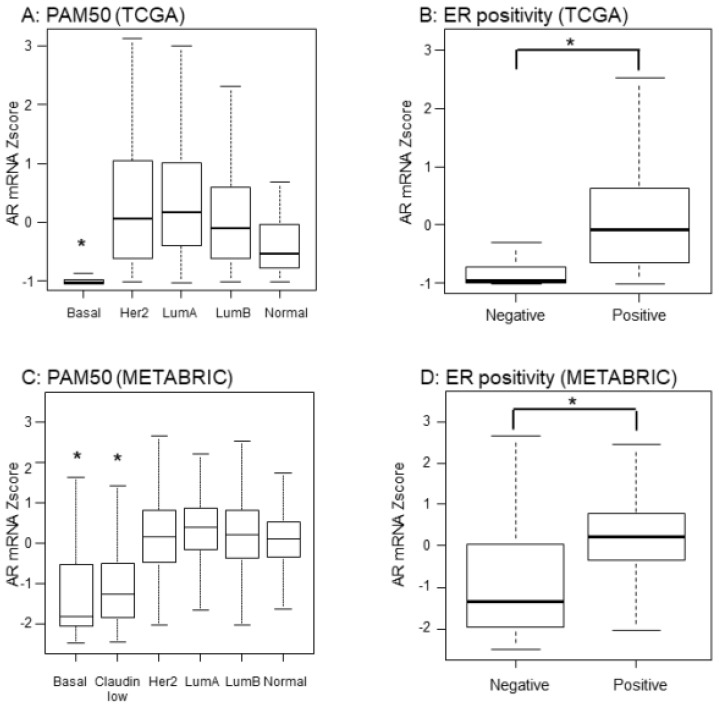
Figure 1.
Expression levels of AR mRNA in TCGA and METABRIC cohorts. AR mRNA levels were quantified by mRNA Z-scores of RNA-sequences. Bold lines demonstrate the median and box plot is 95% interval. * p < 0.001. (A) PAM50 subtype in TCGA; (B) ER positivity defined by IHC in TCGA; (C) PAM50 subtype in METABRIC; (D) ER positivity defined by IHC in METABRIC.

