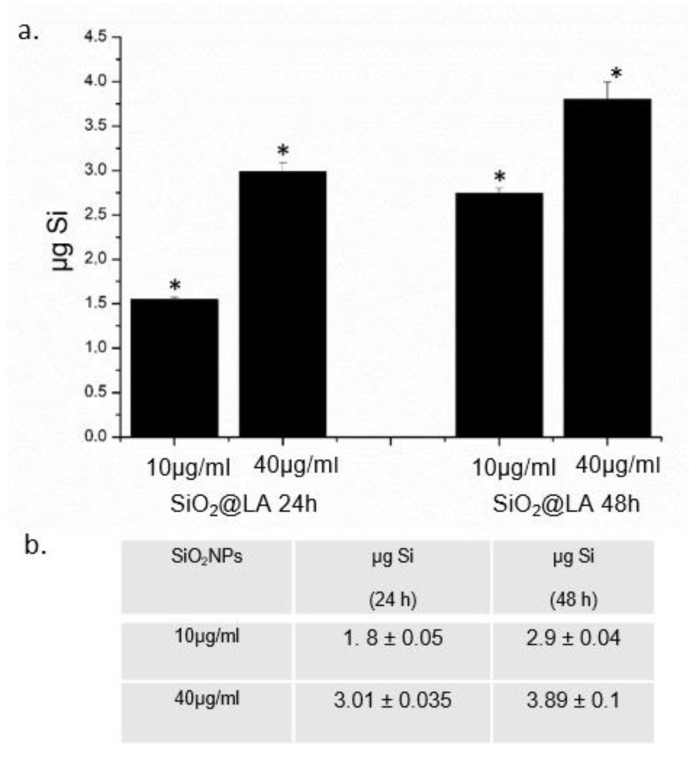
Figure 4.
a. SiO2@LA NPs accumulation in MCF-7 cell lines exposed to 10 µg/mL and 40 µg/mL of NPs for 24 h and 48 h. Cells were then harvested, live cells were counted and Si content was measured in 360,000 cells (μg Si). b. blank SiO2NPs (10 µg/mL and 40 µg/mL) uptake in MCF-7 expressed as µgSi after 24 h and 48 h Data reported as mean ± SD from three independent experiments; statistical significance of exposed cells vs. control cells for p value ˂ 0.05 (<0.05 *).

