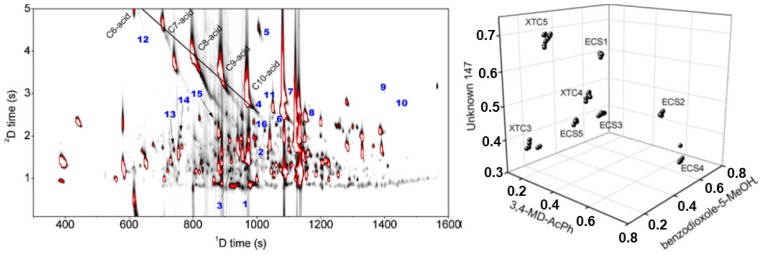
Figure 9.
GC×GC-TOFMS volatile profile of an ecstasy sample, along with the location of the 16 compounds selected for the profile correlation and the identified fatty acids (left). 3D plot of the linear discriminant analysis (LDA) analysis with three selected compounds, showing the clear clustering of the eight groups of ecstasy samples (right). Source: adapted with permission from Mitrevski et al. [165].

