Figure 3.
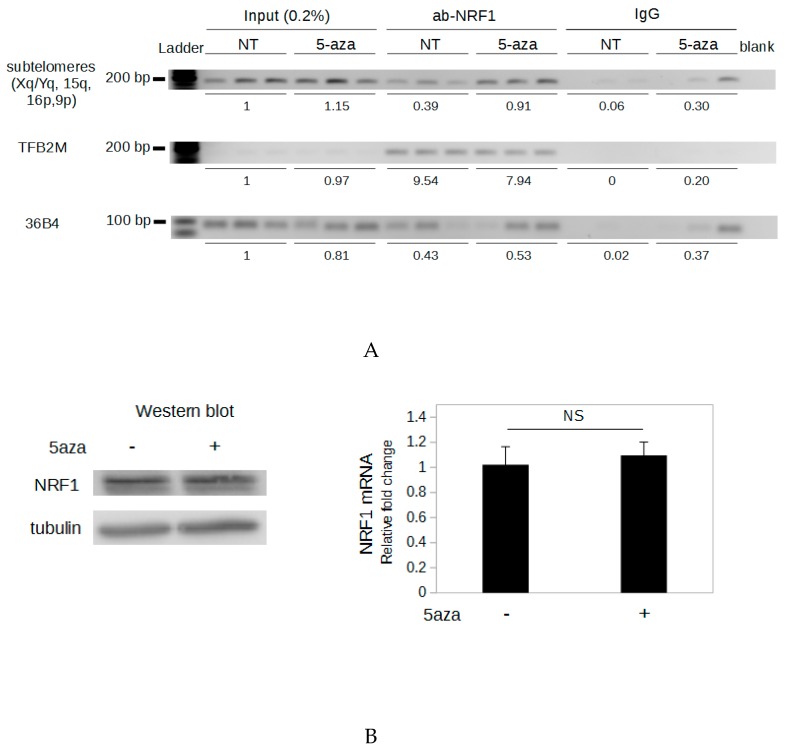
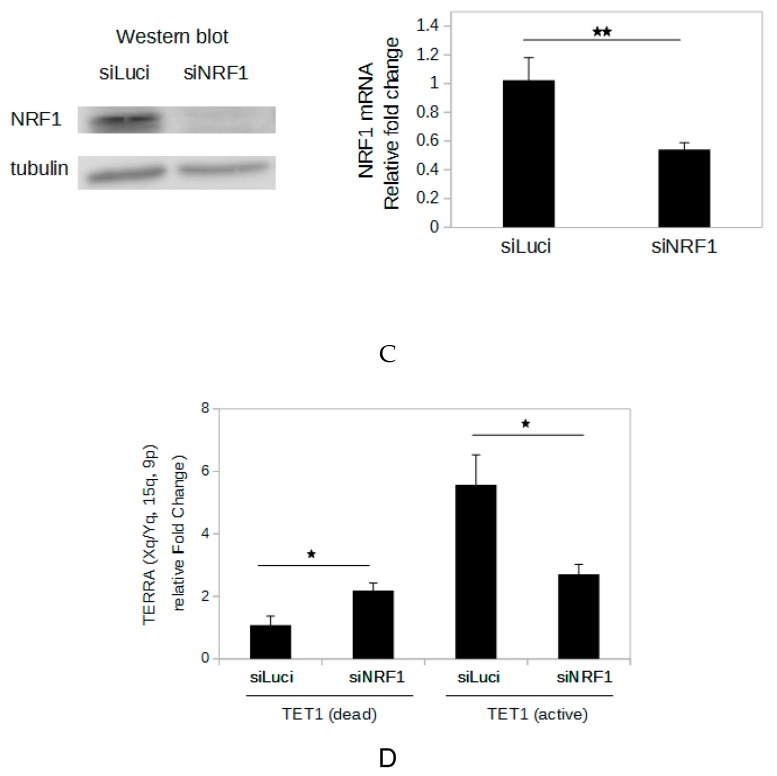
NRF1 (nuclear respiratory factor 1) binding to subtelomeres is involved in DNA methylation-dependent regulation of TERRA expression. (A) Chromatin immunoprecipitation (ChIP) assays were performed using chromatin extracted from HeLa cells untreated (NT) or treated with 10 µM 5-aza-dC (5aza) for 72 h and an antibody that recognizes NRF1 (ab-NRF1) or a non-specific antibody (IgG). Primers specific for subtelomeres Xq, Yq, 15q, 16p, and 9p (ChIP-F/ChIP-R), the promoter region of the TFB2M (transcription factor B2 of the mitochondria) gene (TFB2M-F/TFB2M-R), or a region of the 36B4 gene devoid of NRF1 binding sites (36B4-F/36B4-R) were used to detect co-precipitated chromatin fragments. For each condition (untreated and 5-aza-dC-treated), three biological replicates were used for the ChIP assay. Each lane corresponds to a biological replicate. Values above the gel correspond to the average signal intensity normalized to the Input of untreated cells. Ladder is the 50 bp DNA ladder (New England BioLabs). (B) HeLa cells were untreated (−) or treated (+) with 10 µM 5-aza-dC (5aza) for 72 h. Left, Western blot analysis of NRF1 protein. Tubulin was used as a loading control; 30 µg of total protein was loaded in each well. Right, RT-qPCR analysis of NRF1 mRNA. Levels were normalized to GAPDH mRNA, and all values were compared to untreated cells. (C) HeLa cells were lipofected with small interfering RNAs (siRNAs) targeting NRF1 (siNRF1) or a control siRNA targeting luciferase (siLuci). Lipofections were performed at days 1 and 2, and proteins and RNA were extracted at day 3. Left, Western blot analysis of NRF1 protein. Tubulin was used as a loading control; 30 µg of total protein was loaded in each well. Right, RT-qPCR analysis of the NRF1 mRNA. Levels were normalized to GAPDH mRNA, and all values were compared to cells lipofected with siLuci. (D) RT-qPCR analysis of TERRA produced from Xq, Yq, 15q, and 9p in HeLa cells transfected with the CRISPR-dCas9-TET1 system (TET1 active or dead) and subtelomeric gRNAs then lipofected with siNRF1 or siLuci. Transfection was performed at day 0, lipofections were performed at days 1 and 2, and RNA was extracted at day 3. TERRA was quantified by RT-qPCR using TR and TF; levels were normalized to GAPDH mRNA, and all values were compared to the samples transfected with catalytically dead TET1 and lipofected with siLuci. The bars represent the average values from three biological and two technical replicates for each sample. Error bars represent the standard deviations. p values were calculated by paired two-tailed Student’s t-test (n = 3). * p < 0.05. ** p < 0.01. NS: not significant (p > 0.05).


