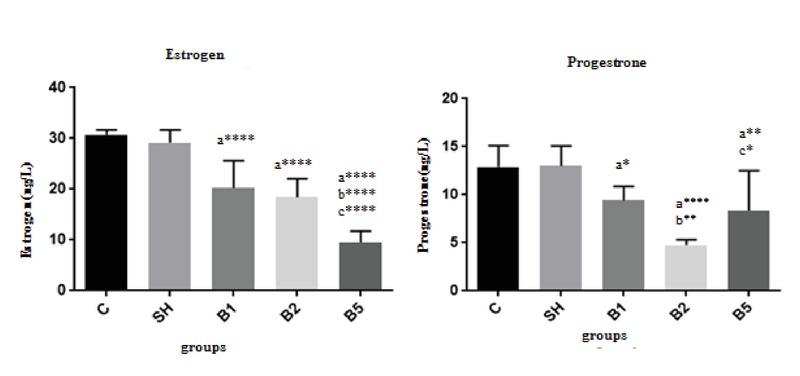
Figure 3.

BaP's effect on estrogen and progesterone levels in the pregnant mice ( = 8). C: The control group received normal saline, SH: Sham group receiving corn oil, B1: The group receiving BaP as 100 µg/kg, B2: The group receiving BaP as 200 µg/kg, B5: The group receiving BaP as 500 µg/kg. The values are as mean SD ( 0.0001:****, 0.01:**, 0.05:*). a: Comparing diverse BaP-receiving groups with the control group, b: Comparing with B1, and c: Comparing with B2; C: The control group received normal saline; SH: The Sham group receiving corn oil; B1: The group receiving BaP as 100 µg/kg; B2: The group receiving BaP as 200 µg/kg; B5: The group receiving BaP as 500 µg/kg.
