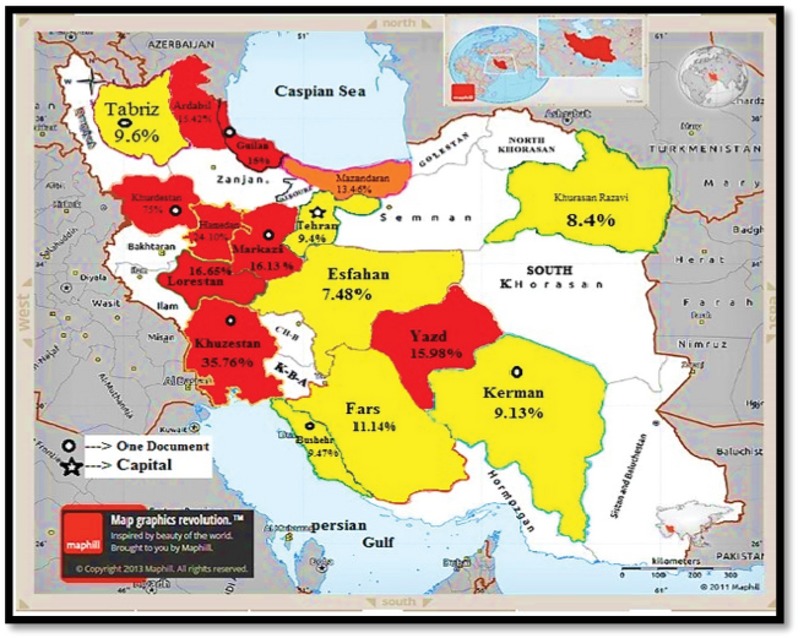
Figure 2.

Map of Iran showing selected studies based on random effects meta-analyses. Red Color: Higher prevalence of GBS colonization in Iranian pregnant women in comparison to total prevalence. Orange Color: Same prevalence of GBS colonization in Iranian pregnant women in comparison to total prevalence. Yellow Color: Lower prevalence of GBS colonization in Iranian Pregnant women in comparison to total prevalence. Source: Map of Iran powered by http://www.maphill.com/, which is marked as `free' and licensed under a Creative Commons Attribution Non-Derivative License (CC BY-ND)("© Maphill / CC BY-ND").
