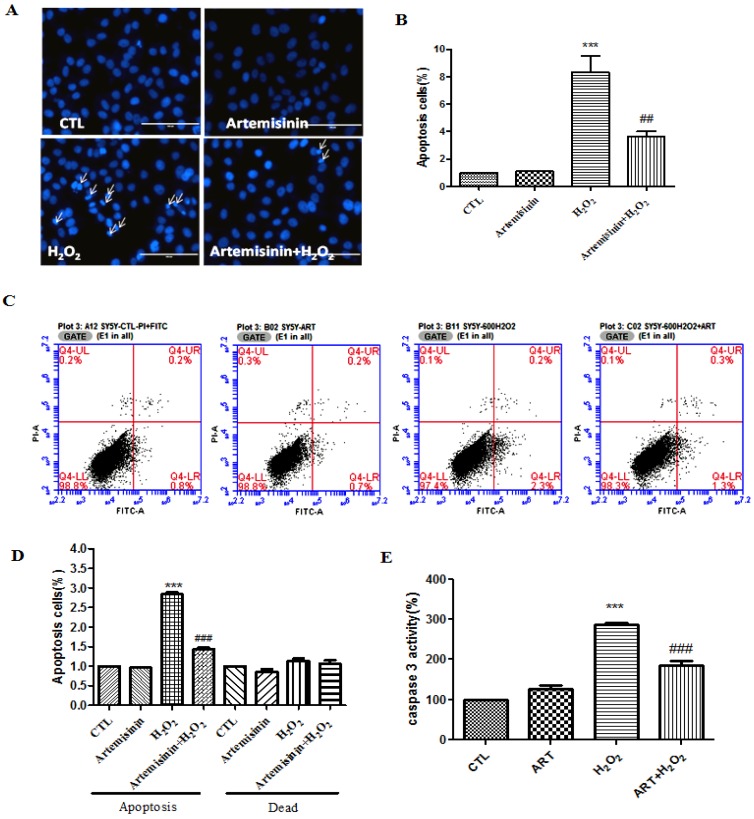
Figure 2.
Artemisinin suppressed H2O2-induced apoptosis in SH-SY5Y cells. Cells were pre-treated with 12.5 μM artemisinin for 2 h and then induced with or without 600 μM H2O2 for another 24 h. The pictures have been taken at a magnification of 40× (100 μm). (A) Photographs of representative cultures measured by Hoechst staining. Apoptotic cells are marked with white arrows (B) Quantitative analysis of (A). (C) Photographs of representative cultures measured by flow cytometry. (D) Quantitative analysis of (C). (E) The activity of caspase-3 was monitored by caspase assay. Data represent means ± SD, *** p < 0.001, ## p < 0.01, ### p < 0.001.

