Figure 3.
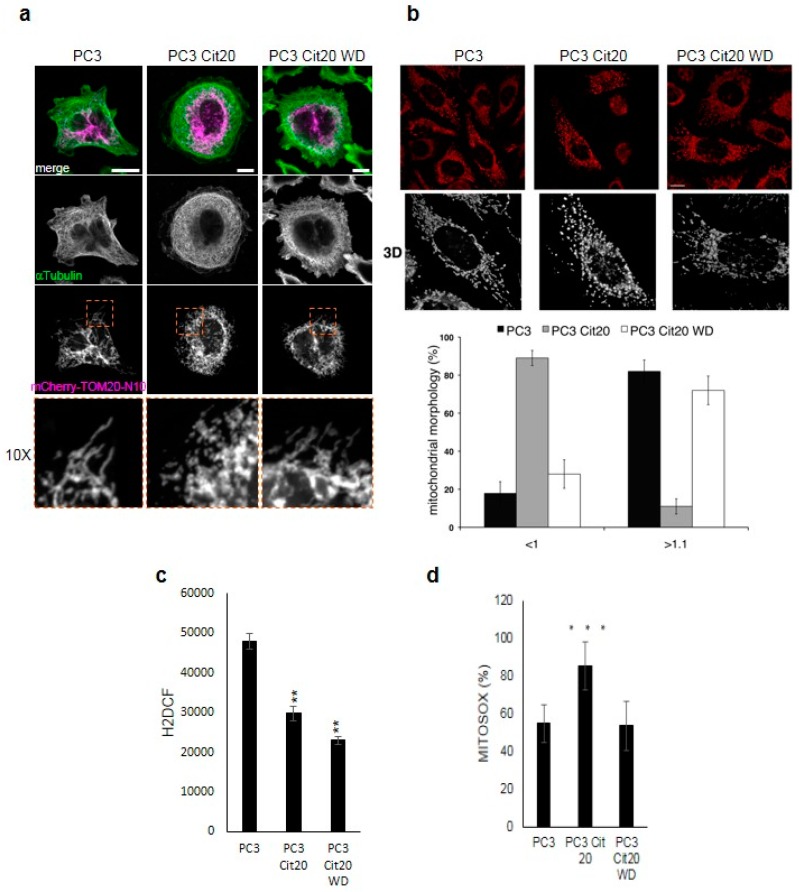
The mitochondrial network is altered in citrate-resistant PC3 cells. Representative images of PC3, PC3 Cit20, and PC3 Cit20 WD cells labeled with mCherry-TOM20-N10 (a) or with MitoTracker Red (b) are shown. In (a), cells were also stained using a mouse monoclonal antibody against αtubulin. In (b), a single Z-section and 3D reconstruction of a higher magnification region is shown. Quantification of mitochondrial shape according to length (in μm) is shown. Bars, mean ± S.D. Scale bar 10 μm. (c) Effects of citrate on ROS production in PC3, PC3 Cit20, and PC3 Cit20 WD cells. ROS levels were estimated indirectly by measuring the fluorescence after 45 min H2DCF addition. Data are expressed as mean ± S.D. of a representative experiment performed in triplicate. (**) indicates statistically significant differences (p < 0.05). (d) Effects of citrate on mitochondrial ROS production in PC3, PC3 Cit20, and PC3 Cit20 WD cells. ROS levels were estimated by Mitosox. Data are expressed as mean ± S.D. of a representative experiment performed in triplicate. (***) indicates statistically significant differences (p < 0.0001).

