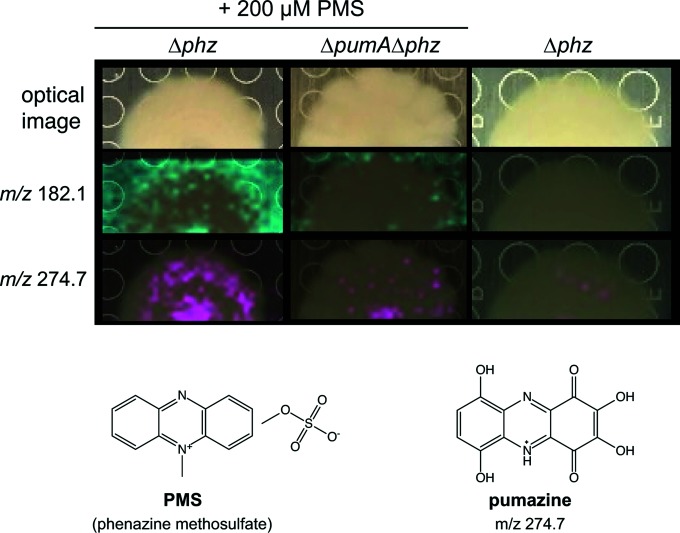
Fig. 4.
Identification of PumA-dependent metabolites. Top: optical images of colony biofilms and imaging mass spectrometry results showing distribution of metabolites with the indicated mass-to-charge (m/z) ratios (in cyan or fuschia) overlaid on colony images. Colonies were grown for 5 days on 1 % tryptone and 1 % agar. PMS was added to the medium where indicated. Bottom: structure for PMS and predicted structure for pumazine.

