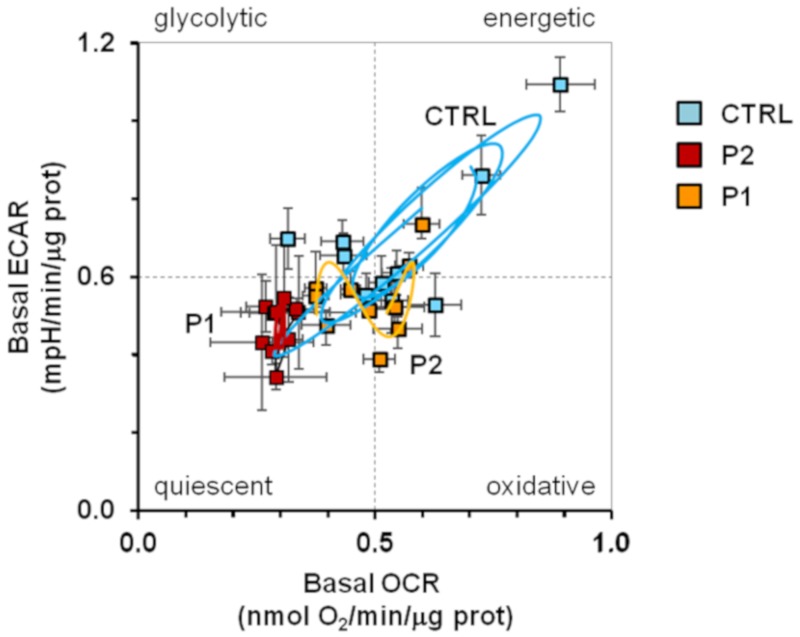
Figure 5.
Bioenergetic profile in synchronized intact fibroblasts. The graph displays the energy map obtained plotting the resting extracellular acidification rate (ECAR) and oxygen consumption rate (OCR) values obtained from data shown in Figure 4 for normal fibroblasts (CTRL, light blue square), and PD patient fibroblasts (P1, red square; P2, orange square); the continuous lines are computed merging the best-fitting COSINOR curves for OCR and ECAR.

