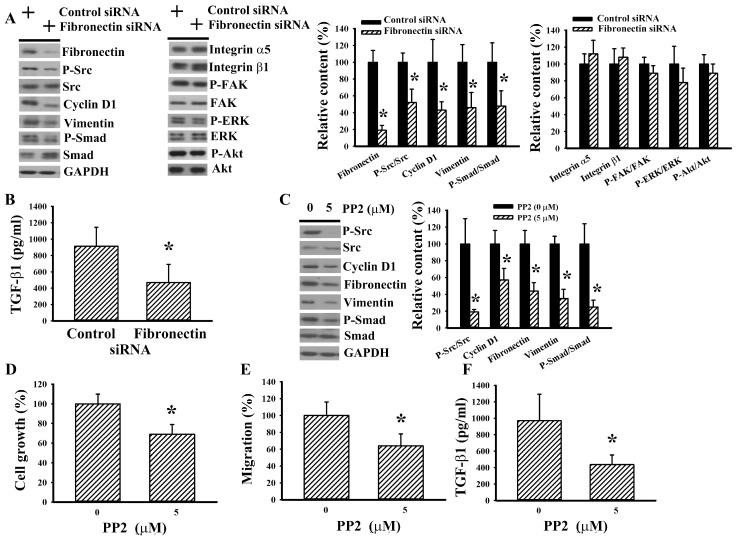
Figure 3.
Fibronectin silencing decreased intracellular Src signaling in 786-O cells. 786-O cells were transfected with control siRNA and fibronectin siRNA for 48 h. (A) Proteins were extracted and subjected to Western blot analysis with indicated antibodies. Representative blots are shown. (B) The resultant transfected cells were seeded onto 24-well plates. Twenty-four hours later, the supernatants were collected and subjected to ELISA for the measurement of TGF-β1. (C) 786-O cells were treated with PP2 (0 and 5 μM) for 5 h. Proteins were extracted and subjected to Western blot analysis with indicated antibodies. Representative blots are shown. (D) 786-O cells were treated with PP2 (0 and 5 μM) for 24 h. Cell growth was measured by MTS reduction assay. (E) 786-O cells were seeded onto Transwell inserts and subjected to Transwell migration assay for 24 h in the presence of PP2 (0 and 5 μM). The lower chambers were filled with DMEM containing 10% FBS. (F) 786-O cells were treated with PP2 (0 and 5 μM) for 24 h. The supernatants were collected and subjected to ELISA for the measurement of TGF-β1. Bar graphs show quantitative results among groups and the value in control siRNA/untreated group was defined as 100% (A, C–E). * p < 0.05 vs. control siRNA/untreated group, n = 3.

