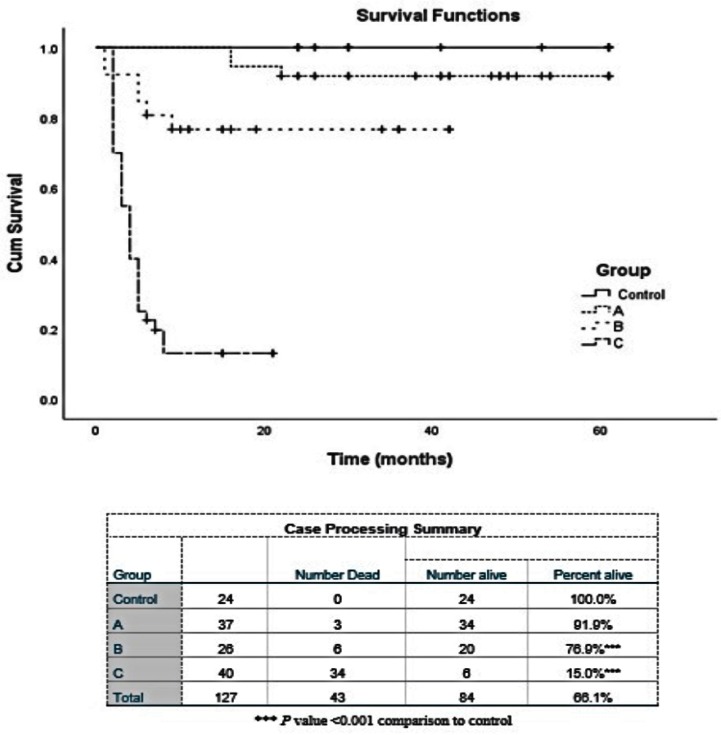
Figure 1.
Kaplan-Meier survival analysis. Kaplan-Meier plots representing the correlation of NF-κB gene expression and survival. Group (A) < 5-fold increase, (B) 5-10 fold, (C) > 10 fold. Patients with low gene expression had longer survival time than those with high expression. For Kaplan-Meier plots, the log-rank test was applied. The log-rank test p value indicates the significance of the correlation.

