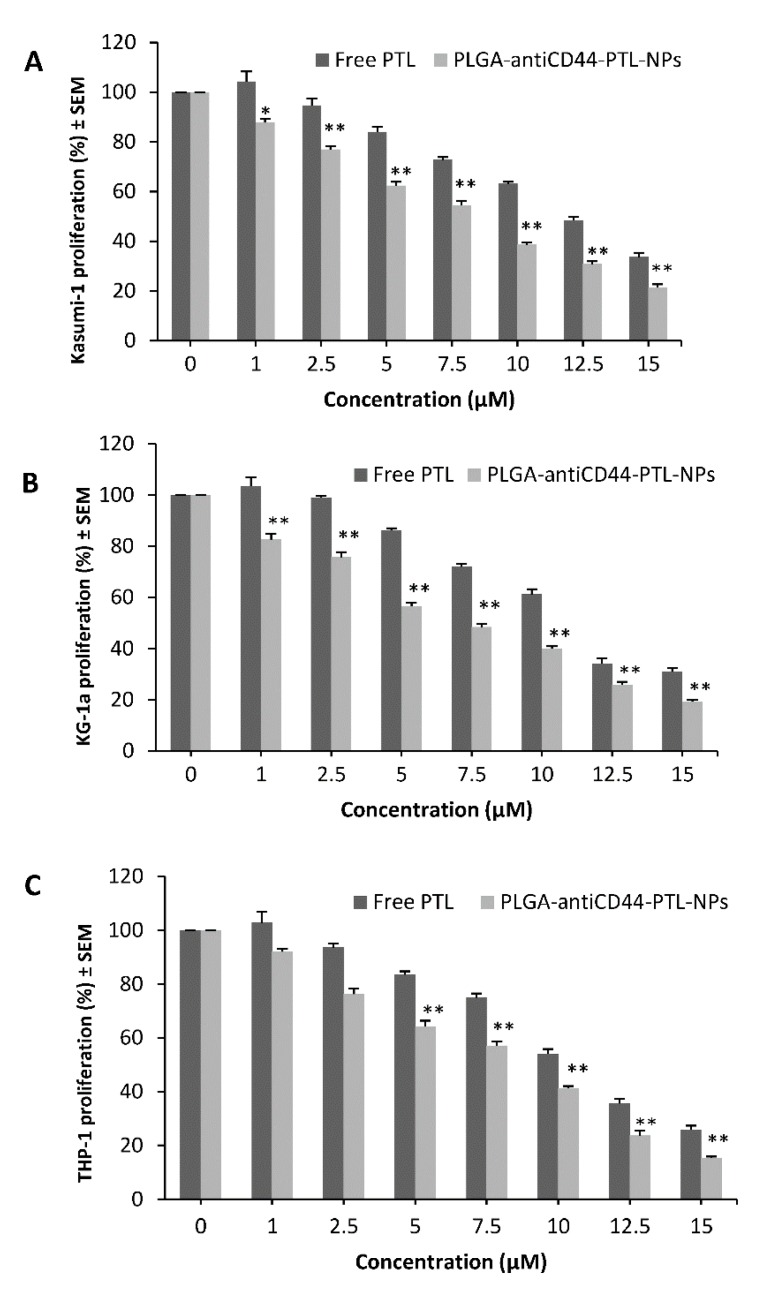
Figure 5.
Cell lines’ proliferation with free parthenolide (PTL) and PLGA-antiCD44-PTL-NPs measured with MTT assay. (A) Kasumi-1 cell line, (B) KG-1a cell line, (C) THP-1 Lucia cell line. Shown with free PTL and PLGA-antiCD44-PTL-NPs at 1.0, 2.5, 5, 7.5, 10, 12.5, and 15 µM. Cell proliferation (% of control) is expressed as mean ± S.E.M., n = 3. One-way ANOVA was used followed by the Newman-Keuls post-test (* p < 0.05, ** p < 0.01 compared to free PTL). Abbreviations: NP, nanoparticle; PLGA, poly lactide co-glycolide; PTL, parthenolide.

