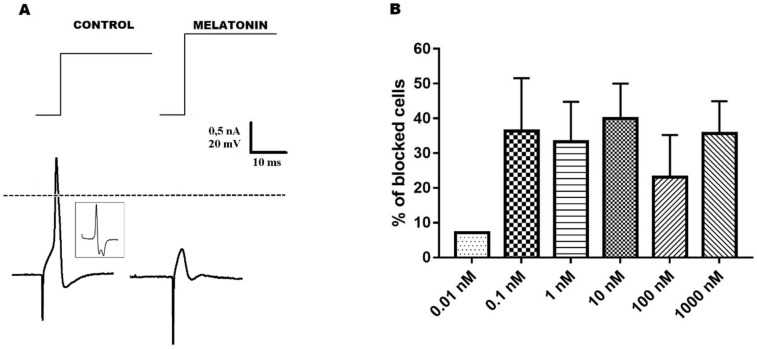
Figure 1.
Melatonin-induced AP blockade in Ninf neurons. Panel A shows representative traces illustrating melatonin effect on the AP of Ninf neurons. Traces represent: upper row–current pulses; lower row–left, control AP; right–exposure to melatonin (1000.0 nM). Insert–dV/dt of control AP. Broken line is zero voltage reference. Panel B shows the percentage of neurons with AP triggering blocked (ordinate) by melatonin 0.01, 0.1, 1.0, 10.0, 100.0, and 1000.0 nM (abscissa). These data, expressed in percentage values, are presented as means ± SEM.

