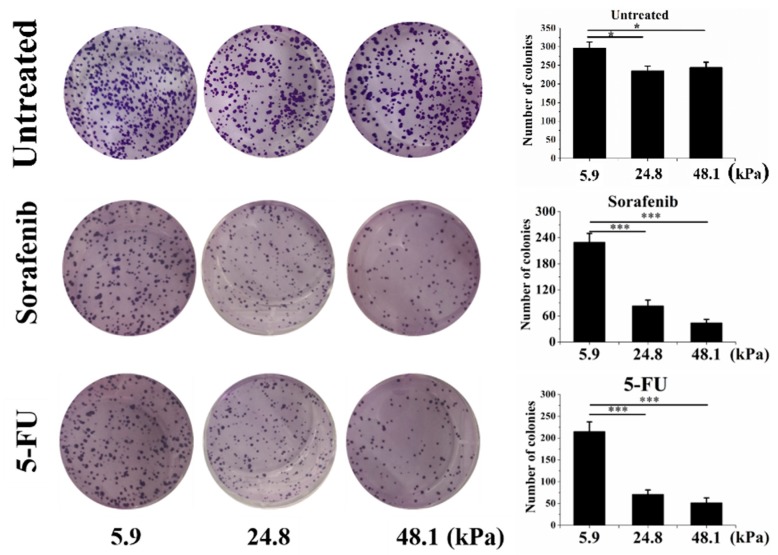
Figure 4.
The chemoresistance of cells grown on matrices with different stiffnesses. The untreated control (top), sorafenib (10 μM; middle) and Fluorouracil (5-FU) (10 μg/mL; bottom) groups are shown. The values are presented as the mean ± SD of three independent experiments. n = 3; * p < 0.05; *** p < 0.001.

