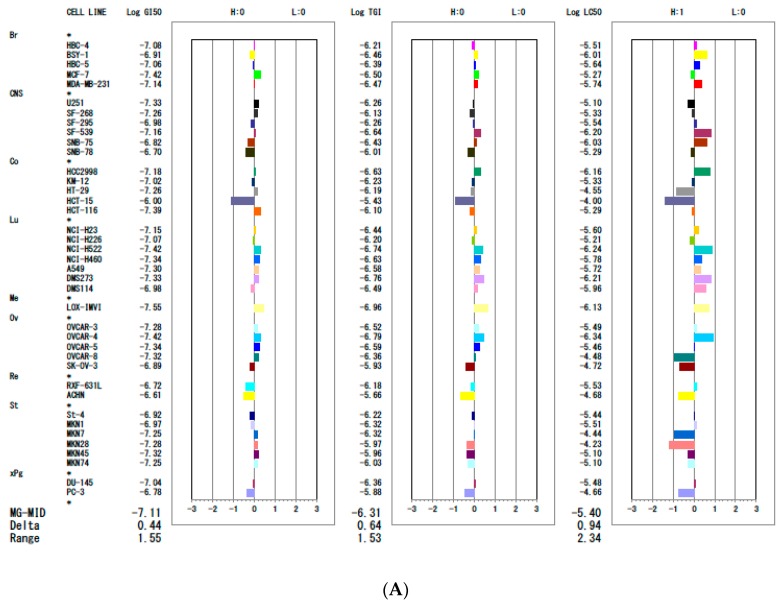
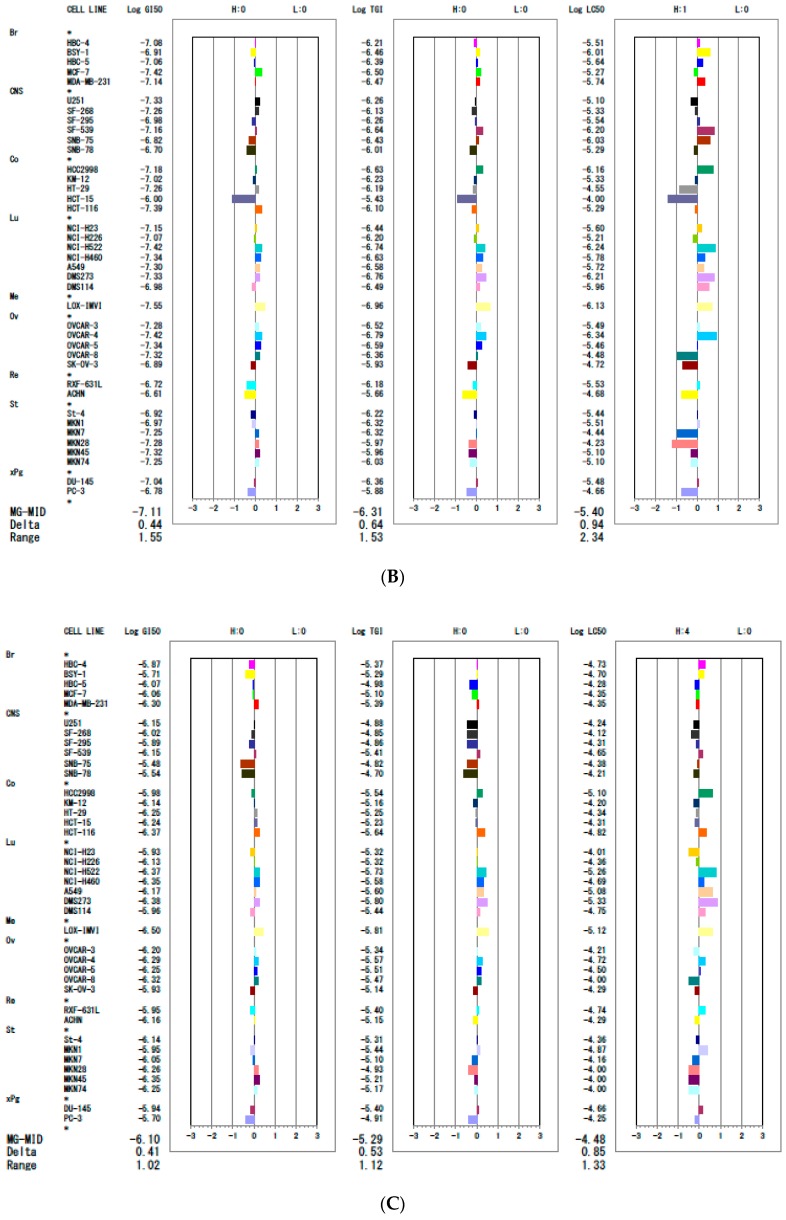
Figure 6.
Growth inhibitory- and cytotoxic activities of compounds (A) 7d, (B) 7k, and (C) 7q across a panel of the JFCR39 cell lines. The mean graph was produced by computer processing of the 50% growth inhibition (GI50) and the 50% lethal concentration (LC50) values. The logarithm of the GI50 and the LC50 values for each cell line is indicated. The X-axis shows the difference on a logarithmic scale between the mean of Log GI50/Log LC50 values for all 39-cell lines (MG-MID, expressed as 0 in the fingerprint) and the Log GI50/Log LC50 for each cell line in the JFCR39 panel. Columns to the right of 0 indicate the sensitivity of the cell lines to a given compound, and columns to the left indicate their resistance. The MG-MID mean of the Log GI50/Log LC50 values for all 39 cell lines; delta difference between the MG-MID and the Log GI50/Log LC50 value for the most sensitive cell line; range difference between the Log GI50/Log LC50 values for the most resistant cell line and the most sensitive cell line.


