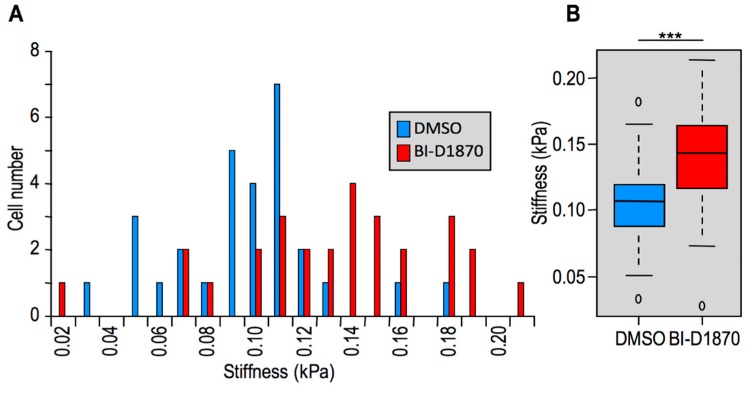
Figure 1.
Cells undergoing mesenchymal-to-epithelial transition (MET) increase their stiffness. (A) Histograms graphs reporting stiffness distributions of the two cell populations analyzed (DMSO 0.05% and BI-D1870 10 μM). (B) Box plot illustrative of median and quantile distributions of the two cell populations (***: p < 0.001).

