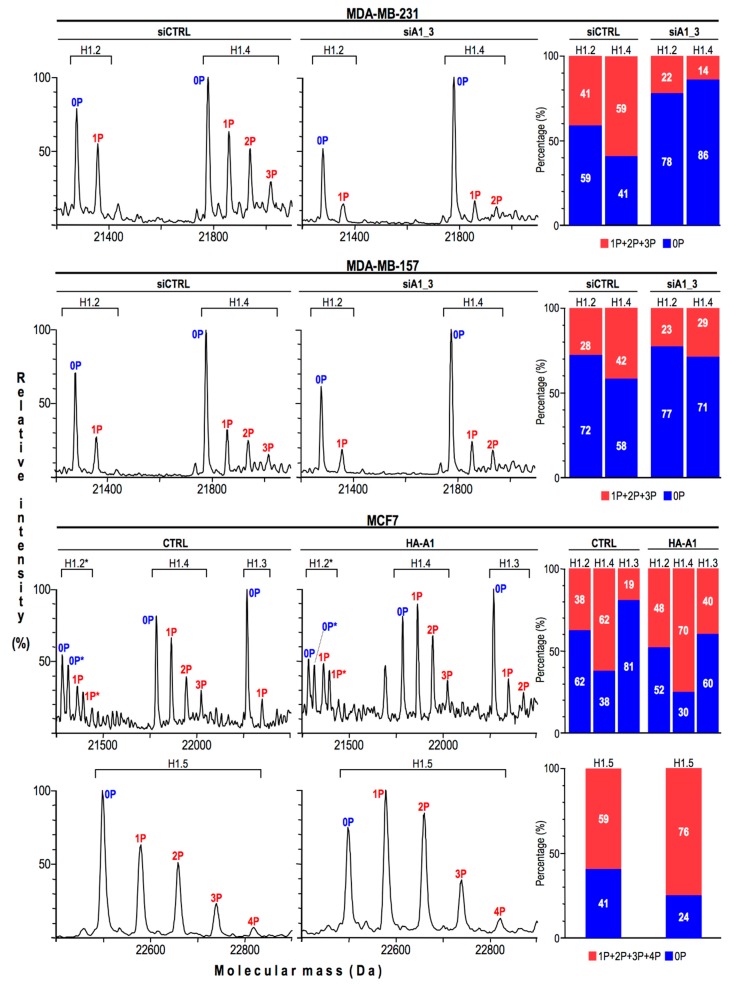
Figure 4.
Histone H1 phosphorylation is linked to HMGA1 expression level. Left part: Reconstructed mass spectra of histone H1 variants obtained from MDA-MB-231 and MDA-MB-157 cells treated with siCTRL and siA1_3 and from control (CTRL) and HA-HMGA1 overexpressing (HA-A1) MCF7 cells. The various histone H1 variants are indicated above each spectrum. 0P, 1P, 2P, 3P, and 4P indicate the number of phosphate groups. *: MCF-7 cells express two histone H1.2 allelic variants. Right part: Histogram graphs showing for each histone H1 variant the distribution in terms of percentage between unphosphorylated (0P) and phosphorylated forms (1P+2P+3P+4P). The percentage values are indicated within each bar.

