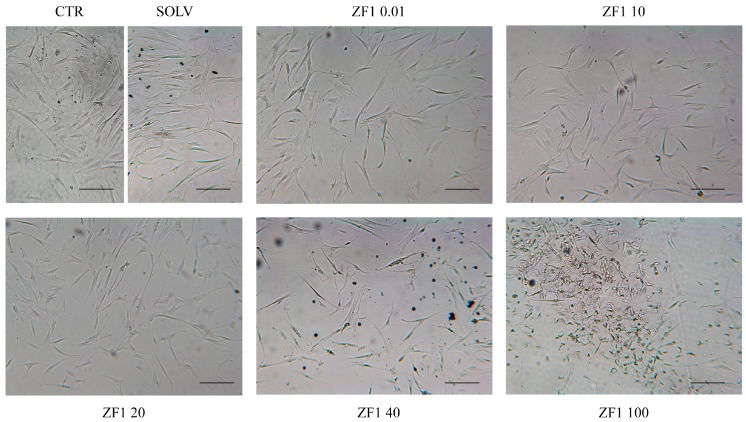
Figure 2.
Representative images of hASCs treated with ZF1 at different concentrations (0.01, 10, 20, 40, and 100 μg/mL) or with a solvent (SOLV) or untreated (CTR). Cytotoxicity was evaluated with a morphological analysis. Images were obtained with an optical microscopy (40× magnification and bright field illumination). Scale bar corresponds to 200 μm.

