Figure 4.
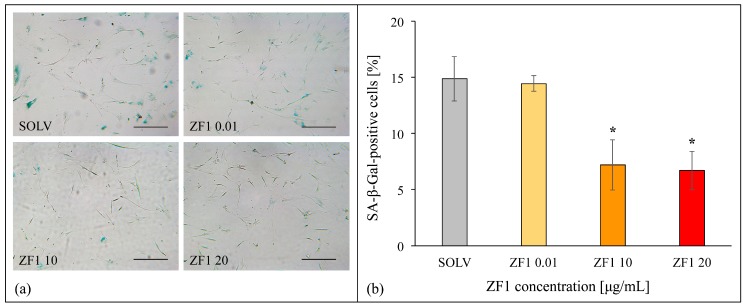
Effects of different concentrations of ZF1 on SA β-gal activity in hASCs. The hASCs (culture passages 5th–7th) were seeded in 6-well plates and were cultured in the presence of 0.01, 10, and 20 μg/mL ZF1, or a solvent as a control for 72 h, then processed for SA β-gal assessment. (a) Images represent hASCs after SA β-gal staining. SA β-gal positive cells are blue. The scale bar corresponds to 200 μm; (b) Positive (blue) and negative (not colored) cells were counted in at least three random fields for each technical replicate under the microscope (200× magnification and bright field illumination). Data represent the percentage of SA β-gal positive cells calculated as the number of positive cells divided by the total number of counted cells multiplied by 100 (percentage of blue cells ± SD, n = 3, statistical significance was calculated using the Student’s t-test, * p < 0.05).

