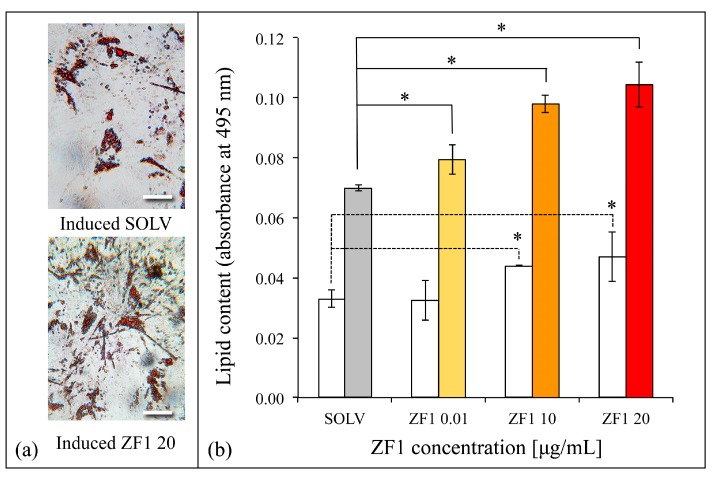
Figure 6.
Effects of ZF1 treatment on adipogenic differentiation in hASCs at different concentrations. The hASCs (culture passages 5th–7th) were seeded in 24-well plates and were cultured in the presence of 0.01, 10, and 20 μg/mL ZF1, or solvent (SOLV) as a control for 72 h. (a) Images represent hASCs Oil red O staining after treatment with solvent (above) or ZF1 20 μg/mL (below) and adipogenic medium. Cells positive for adipogenesis showed red colored vacuoles in cytoplasm. Scale bar corresponds to 100 μm; (b) White histograms represent data derived from hASCs cultured in basal medium, while colored histograms represent those from hASCs treated with adipogenic medium. The lipid-rich vacuoles Oil Red O dye was extracted by wells and its absorbance was read at 495 nm with a spectrophotometer. Data are expressed as mean of lipid content at 495 nm absorbance ± SD. Horizontal dashed or continuous black lines represent the significance of differences between data obtained from hASCs cultured in basal and from an adipogenic medium, respectively (statistical significance was calculated using the Student’s t-test, * p < 0.05, n = 3).

