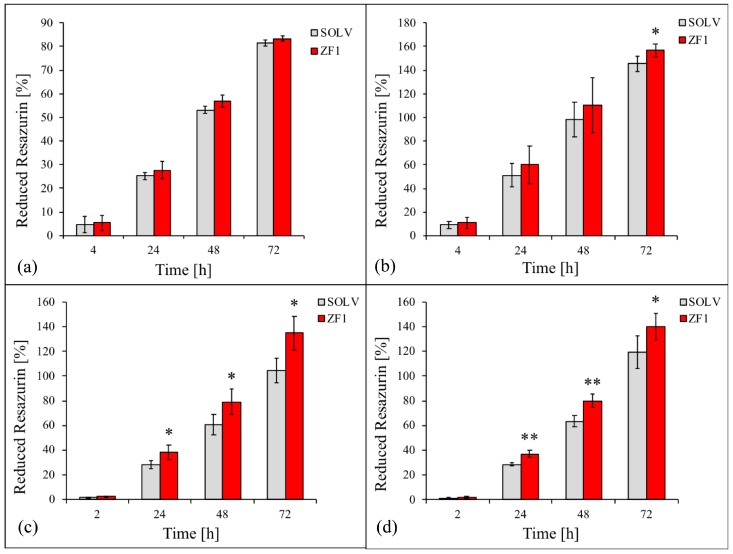
Figure 7.
The effects of different concentrations of ZF1 on metabolic activity in hMSCs. The hASCs (a), hBM-MSCs (b), hDP-MSCs (c) and hWJ-MSCs (d), at passages 5th–7th, were exposed for 72 h in the presence of 20 μg/mL ZF1, or solvent as a control (SOLV). An analysis of the percentage of the reduction of resazurin (as an indicator of cell proliferation) was conducted at 4, 24, 48, and 72 h from the beginning of the treatment and data are expressed as mean (n = 3) ± SD. Statistical significance was analyzed with ANOVA followed by the Tukey HSD test, * p < 0.05, ** p < 0.01.

