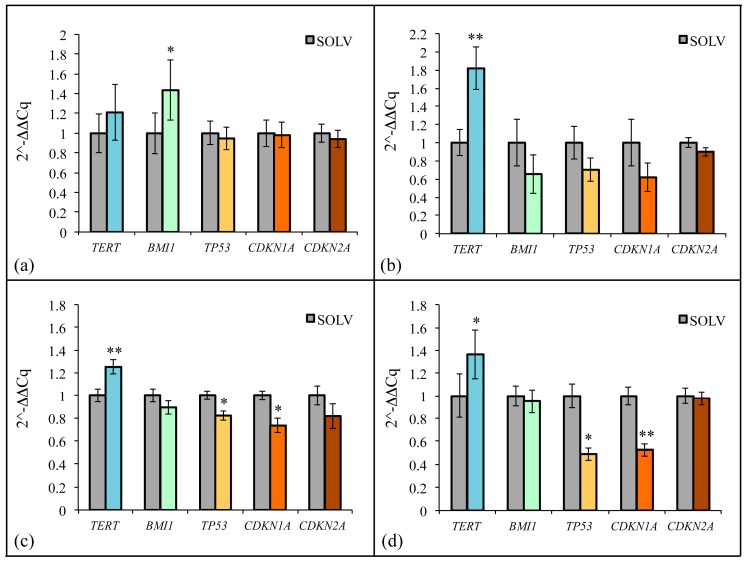
Figure 10.
Effect of ZF1 on gene expression in hMSCs. The hASCs (a), hBM-MSCs (b), hDP-MSCs (c) or hWJ-MSCs (d), at passages 5th–7th, were exposed for 72 h in the presence of 20 μg/mL ZF1, or a solvent (SOLV) as a control. The expression value of the transcripts evaluated in the solvent or ZF1-treated cells, was normalized to the expression levels of three reference genes, HPRT1, GAPDH, and TBP. The amount of the target mRNA in the ZF1 treated cells was plotted as the fold change over the expression in the control cells. The experiments were all performed with cells derived from three subjects. Statistical significance was evaluated by using the CFX Manager Software version 3.1 (Bio-Rad Laboratories) and the Student’s t-test (mean ± SD, * p < 0.05, ** p < 0.01, n = 3).

