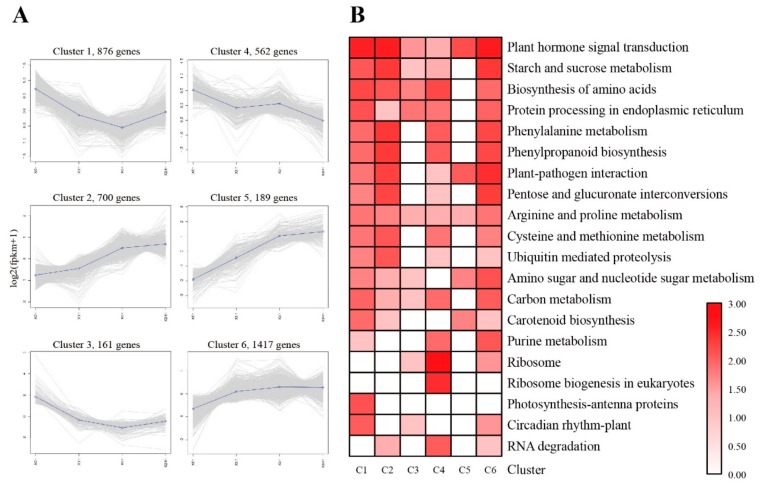
Figure 4.
Co-expression clustering showing the expression profile of 3905 DEGs. (A) Six major clusters were identified along the time course of cold stress (0, 1, 3 and 24 h). The X-axis represents the time course of freezing stress (0, 1, 3 and 24 h). The Y-axis represents the value of the relative expression level (log2 (FPKM + 1). (B) Functional category enrichment among the six major clusters is based on KEGG annotation.

