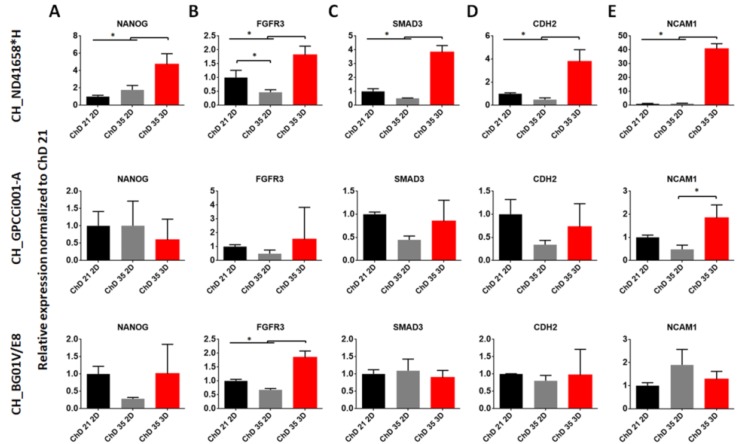
Figure 2.
The effect of prolonged and 3D culture on expression of pluripotent (A), chondrogenic signaling pathways (B,C) and mesenchymal condensation (D,E) marker genes. RT-qPCR represents gene expression of markers specific to chondrogenesis during chondrogenic differentiation. As a control, the differentiated PSC cells at ChD 21 2D was used. The error bars represent SD from three experiments. The statistical analysis was performed using ANOVA with Tukey’s post-hoc multicomparison test (* p < 0.05). ChD—Chondrogenic differentiation; 2D—two-dimensional culture; 3D—three-dimensional culture.

