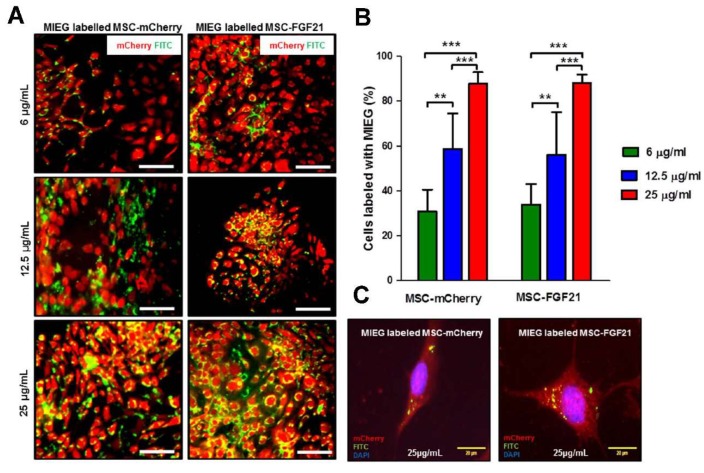
Figure 3.
In vitro labeling of MSCs with MIEG. (A) Presence of MIEG in MSCs was detected by fluorescence microscope. Representative images fluorescence microscope of MSC-mCherry and MSC-FGF21 incubated with different concentrations of MIEG for 24 h. (B) Labeling percentage in monolayer cultures of MSC-FGF21 and MSC-mCherry exposed to 6, 12.5, and 25 μg/mL of MIEG for 24 h. (C) Representative fluorescence microscope image demonstrating the characteristic intracellular distribution of MIEG (green) in MSCs after 24 h. Data represent mean ± S.E.M. of triplicate values from three separate experiments. ** p < 0.01, *** p < 0.005. Scale bar 50 μm unless stated otherwise.

