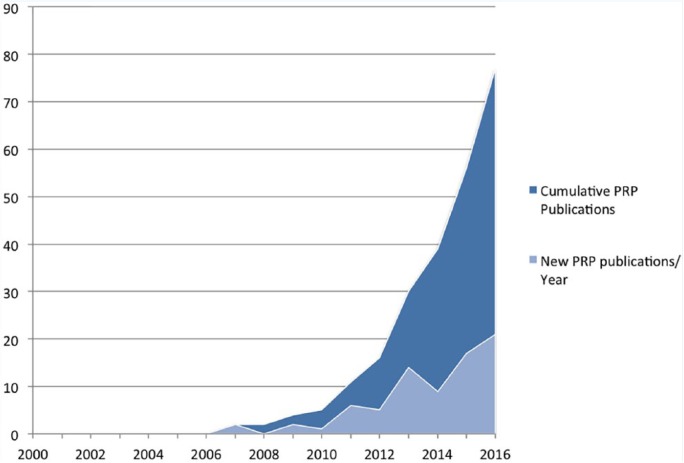
Figure 2.
Graphic depiction of the number of randomized controlled trials (RCTs) published annually (light shade) as well as the cumulative number of RCTs (dark shade) relative to the year of publication since the year 2000. The number of RCTs is on the y-axis, with year of publication along the x-axis. Note the rapid rise in RCTs examining this emerging therapy over the past decade. PRP, platelet-rich plasma.

