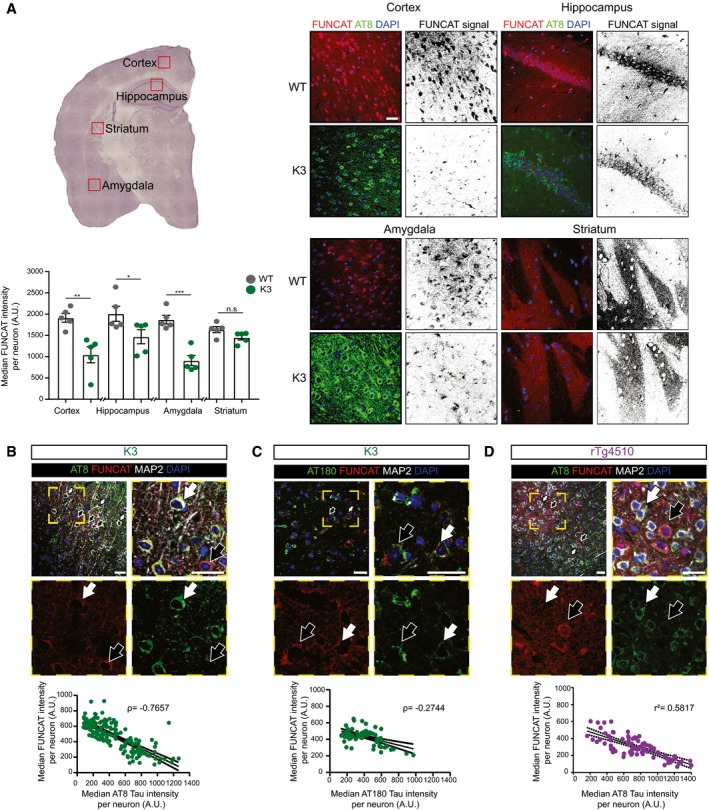
In 5‐month‐old K3 mice, brain regions analysed by microscopy corresponding to layer 2/3 of the cortex, the CA1 region of the hippocampus and the amygdala, which contain neurons with high levels of AT8‐positivity, show significantly less FUNCAT signal compared with WT brains. In the striatum, where no AT8 immunoreactivity is observed, there is no difference in FUNCAT signal between the two genotypes (two‐way ANOVA, Sidak's multiple comparison test, n = 5 animals, three sections per animal).
In layer 2/3 of the cortex of 5‐month‐old K3 mice, the FUNCAT signal negatively correlates with AT8 tau. Neurons with strong AT8 tau pathology and a low FUNCAT signal are indicated by white filled arrows, whereas neurons with low AT8 tau pathology and a high FUNCAT signal are indicated by black filled arrows (Spearman's correlation, ρ = −0.7657, standard error of correlation shown by black dotted line, n = 5 animals, 30 neurons per animal).
FUNCAT signal is negatively correlated with AT180 signal in layer 2/3 of the cortex of 5‐month‐old K3 mice. Neurons with high AT180 tau pathology and a low FUNCAT signal are indicated by white filled arrows, whereas neurons with low AT8 tau pathology and a high FUNCAT signal are indicated by black filled arrows (Spearman's correlation, ρ = −0.2744, p standard error of correlation shown by a black dotted line, n = 5 animals, 15 ≤ neurons per animal).
FUNCAT and AT8 tau signal are negatively correlated in layer 2/3 cortical neurons of 3‐month‐old rTg4510 mice. Neurons with strong AT8 tau pathology and a low FUNCAT signal are indicated by white filled arrows, whereas neurons with low AT8 tau pathology and a high FUNCAT signal are indicated by black filled arrows (Pearson's correlation, r
2 = 0.5817, standard error of correlation shown by a black dotted line, n = 3 animals, 30 neurons per animal).
Data information: Mean ± SEM. *
≤ 0.001. Scale bar: 40 μm.