
Figure 3. Alteration of specific cellular pathways revealed by quantitative de novo proteomics analysis of K3 mice.
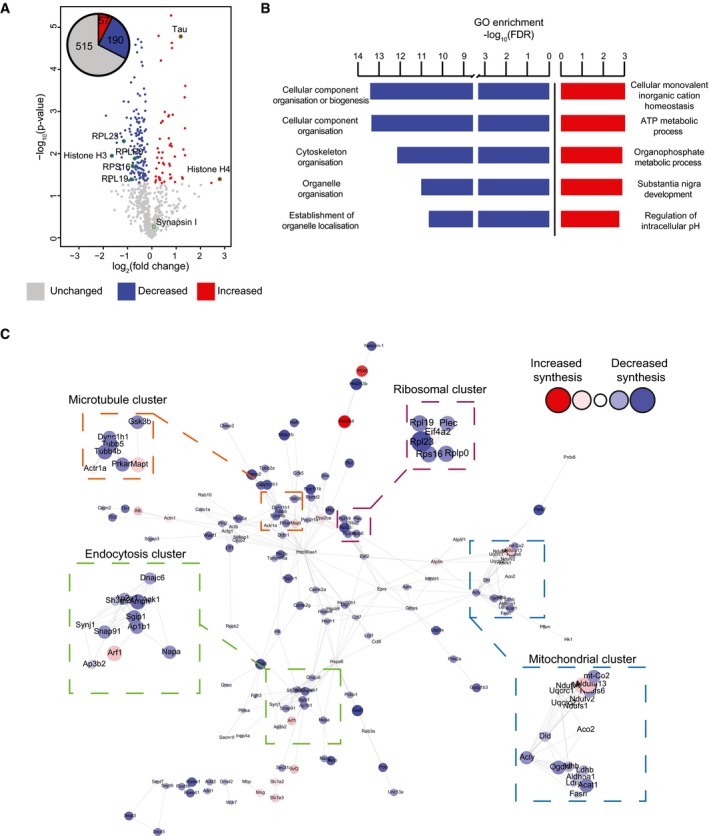
- Relative abundance of de novo synthesised proteins in 5‐month‐old K3 and WT mice. 762 proteins were quantified using SWATH‐MS across 5 K3 and 5 WT samples. The fold‐change was calculated for individual proteins by comparing the relative protein abundance in K3 vs. WT mice. Proteins displaying significantly increased synthesis in K3 mice (fold‐change > 1, P ≤ 0.05) are shown in red, whereas those exhibiting significantly decreased synthesis (fold‐change < 1, P ≤ 0.05) are shown in blue. Candidate proteins are encircled in green.
- Gene ontology (GO) analysis of proteins which were significantly altered in synthesis in K3 mice. GO analyses were performed separately for proteins exhibiting significantly increased or decreased synthesis in K3 mice using the STRING database. The 5 biological functions identified with the lowest false discovery rates (FDR) are displayed.
- STRING network analysis of proteins with significantly altered synthesis in K3 mice. Only interactions with a STRING score ≥ 0.7 are shown. Evidence of interaction is represented by the distance between nodes, with more tightly packed nodes having a higher STRING score. Proteins that did not display interactions are not shown. Node size and colour are linearly related to fold‐change. The microtubule, endocytosis, mitochondrial and ribosomal clusters contain tightly packed nodes and are depicted magnified in the inserts.